Bearish Price Action Continuation Technically, a falling wedge should be a bullish pattern, but with OXT every pattern is a Bearish pattern. OXT has been in a downtrend for close to 6 years and it continues to form lower highs and lower lows. OXT broke below its all time low. Price has broken and closed below the support line of the falling wedge. Price has been struggling to get back into the falling wedge which could mean that the bottom is not in for OXT and there is more downside price action awaiting for this failed project. Failed VPN, Failed GenAi. OXT started with good ideas, but all of them have failed. OKX delisting did not help this project in the middle of a bull market. Let me be clear, the crypto market is in a bull market, but OXT is in a bear market. Suspension of X account added to Orchid’s misery. The launch of GenAi has only tried to keep Orchid relevant in the crypto space, but it has utterly failed in keeping Orchid relevant in a competitive environment. The price chart reflects the failure of the team and when the chart is studied properly, it becomes evident that this failed token is used for many pumps and dump scams as well, which may be a reason to delist OXT in many major crypto exchanges in a near future.
OXTUSDT.P trade ideas

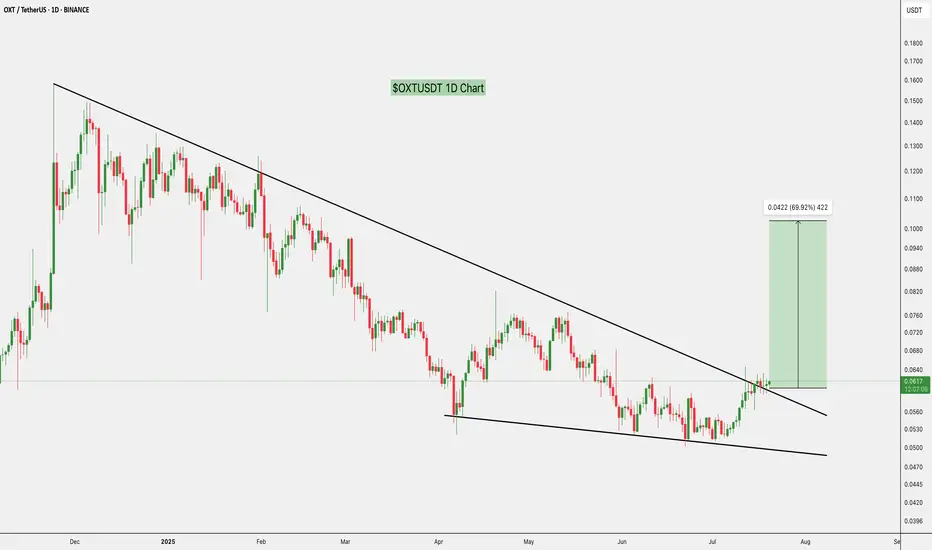
OXTUSDT 1D#OXT is moving inside a falling wedge pattern on the daily chart. Consider buying here at the current price and near the support level of:
🛡 $0.0501
In case of a breakout above the wedge resistance, the potential targets are:
🎯 $0.0629
🎯 $0.0708
🎯 $0.0773
🎯 $0.0837
🎯 $0.0928
🎯 $0.1044
⚠️ Always remember to use a tight stop-loss and follow proper risk management.

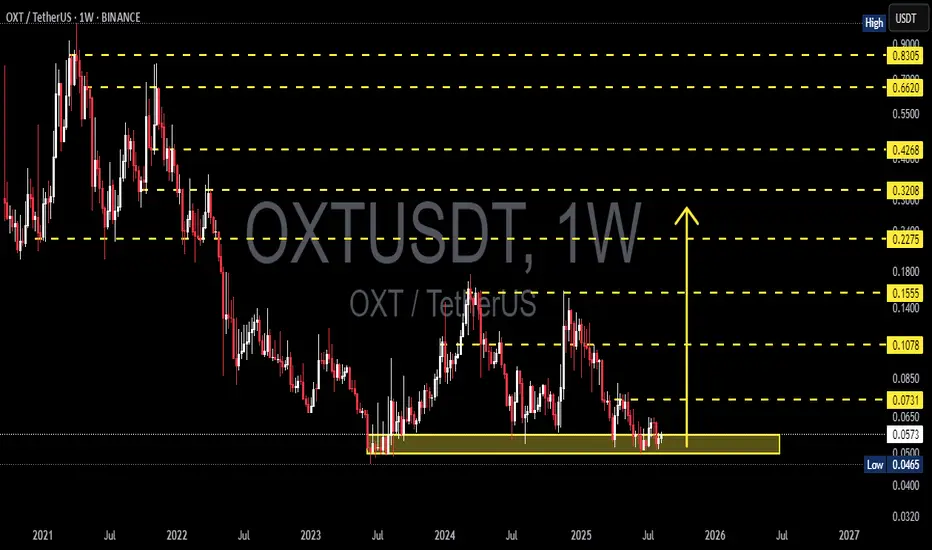
OXT/USDT — Decision Zone: Reversal or Breakdown?🔎 Overview
The OXT/USDT pair is currently sitting at a critical juncture. Since the 2021 peak, the price has been under consistent bearish pressure, forming a series of lower highs. On the other hand, from 2023 until now, OXT has repeatedly held the historical support zone at 0.0465 – 0.0600 (highlighted yellow box).
This area signals a potential accumulation phase, where long-term investors may view the price as “undervalued.” Simply put, the market is balancing between two extremes — a multi-year reversal (triple-bottom) or a breakdown into new lows.
---
🟢 Bullish Scenario — Reversal from Multi-Year Support
The accumulation zone (0.0465 – 0.0600) has held for more than 2 years, forming a potential triple-bottom structure.
A weekly close above 0.0731 would be the first signal of recovery momentum.
Stronger bullish confirmation comes at a breakout above 0.1078, which would mark the first higher high after years of decline.
Potential upside targets:
🎯 0.1555 (mid-level resistance)
🎯 0.2275 (major swing target)
🎯 0.3208 – 0.4268 (longer-term distribution zone if trend reversal extends).
If validated, this area could represent a “generational buy zone” for long-term investors.
---
🔴 Bearish Scenario — Breakdown & Continuation of Downtrend
Failure to defend 0.0465 with a confirmed weekly close below this level would invalidate the 2-year base.
A breakdown could trigger a capitulation wave, with price seeking new, lower support levels (not visible on current chart).
Psychologically, losing this long-held support could fuel panic selling, making the decline sharper than previous moves.
Bearish continuation is only confirmed with a weekly close below the yellow support box, not just a wick.
---
📐 Pattern & Structure
Main trend: Bearish since 2021 (lower highs remain intact).
Current structure: Multi-year range/consolidation → possible accumulation.
Formations:
Triple-bottom / Accumulation zone (if held).
Descending structure remains in play (as long as 0.1078 is not reclaimed).
Interpretation: OXT is at the psychological tipping point between “capitulation” or the early stage of a new trend.
---
⚖️ Conclusion
The 0.0465 – 0.0600 zone is the make-or-break area for OXT/USDT.
Bullish case: Multi-year reversal potential if weekly closes above 0.0731 → 0.1078.
Bearish case: Weekly close below 0.0465 = breakdown and continuation of long-term downtrend.
For swing traders and investors, the current area may offer the best risk-reward zone — but weekly close confirmation remains the key.
---
#OXT #Oxen #USDT #Crypto #AltcoinAnalysis #TechnicalAnalysis #SupportResistance #Accumulation #Breakout #TripleBottom #BearishVsBullish #SwingTrading

OXT/USDT — Accumulation Before a Breakout or Further Decline?📌 Overview
OXT/USDT is currently at a critical stage on the weekly chart, consolidating within the strong demand zone at 0.0465–0.0650 (yellow box) that has been tested multiple times since mid-2023. This area acts as the last line of defense for buyers before price enters uncharted multi-year lows. The macro structure remains in a long-term downtrend since the 2021 peak, but the base formation in this low zone opens up a significant opportunity for a medium-term relief rally if a breakout is confirmed.
---
1. Key Technical Levels
Main Support / Demand Zone (yellow box): 0.0465 – 0.0650
→ This is the “floor” that has been holding price for nearly two years.
Minor Support: 0.0500 (psychological & repeated reaction level)
Layered Resistance Levels:
0.0731 → 0.1078 → 0.1555 → 0.2275 → 0.3208 → 0.4268 → 0.6620 → 0.8305
---
2. Structure & Patterns
Macro Trend: A sequence of lower highs since 2021 → indicating the primary trend is still bearish.
Potential Pattern:
Base / Accumulation Range near multi-year lows → resembles an early rounding bottom, but not confirmed yet.
Possible spring pattern: brief drop below main support followed by a sharp reclaim.
Volume (not shown here): Often decreases near the bottom range, signaling sellers may be losing strength.
---
3. Bullish Scenario (Relief Rally Potential)
💡 Conservative confirmation:
Break & weekly close above 0.0731.
Step-by-step targets: 0.1078 → 0.1555 → 0.2275.
0.1078 is the key breakout pivot; clearing it could trigger large-scale short covering.
⚡ Aggressive setup:
False breakdown below 0.0465 (spring) followed by a quick weekly close back above 0.050–0.055.
Initial target: 0.0650, then 0.0731 if momentum continues.
Best suited for swing traders aiming for high risk/reward.
---
4. Bearish Scenario (Trend Continuation)
Clean weekly close below 0.0465 + failed retest (0.0465 turning into resistance).
Downside targets: 0.0400 then 0.0320.
Failure to break 0.0731 and forming another lower high would also indicate sellers remain in control.
---
5. Strategic Notes
The 0.0465–0.0650 zone is the final battleground between long-term buyers and sellers controlling the macro trend.
Patience is required on this 1W timeframe; valid breakouts may take several weekly candles to confirm.
Aggressive traders may consider entries within the yellow box with tight stops below 0.0465, while conservative traders can wait for a confirmed breakout above key resistance.
---
6. Key Takeaway
As long as price holds inside or above the yellow box, relief rally potential remains alive.
Breaking 0.0731 will be the first major signal of sentiment shift.
A breakdown below 0.0465 opens a new chapter in the long-term downtrend.
#OXT #OXTUSDT #OrchidProtocol #CryptoAnalysis #PriceAction #WeeklyChart #SwingTrade #SupportResistance #BreakoutSetup #CryptoTrading
$OXT Breaks Out, 70% Rally on the TableASX:OXT has broken out of a long falling wedge, a bullish signal.
If it holds, we could see a move toward $0.105 (+70%).
Watch for a retest to confirm the breakout.
DYOR, NFA
Orchid 290% Profits Target, MA200 & Price Action FractalThe classic signals are already present on this chart, the double-bottom, etc. But I also have a price action fractal plus an unconventional signal supporting a bullish jump.
The easy target here is 290%, it can be hit within months. Not more than two to be more exact after the bullish breakout is confirmed. Long-term there can be more growth.
The price action fractal is a 1,2,3 sequence. A correction leads to a low that leads to sideways and then a bullish breakout. (1) The correction, (2) then consolidation and finally (3) the bullish breakout.
The unconventional signal revolves around MA200. When MA200 starts to curve down prices tend to shoot up. Right now this indicator only has a tiny curve but this is the start.
If you look at the action around September 2024, MA200 started to curve down. Prices continued sideways for more then a month but eventually a bullish jump developed. It always happens when MA200 starts to curve down. As it goes down, prices go up.
This is another signal that can be used to spot a trend reversal.
Thanks a lot for your continued support.
Namaste.

Will Orchid (OXT) rally to broken market structure?On the above 5 day chart price action has corrected almost 70% since the year began. A number of reasons now suggest a reversal in trend, they include:
1. Price action and RSI resistance breakouts.
2. A significant confirmation that legacy downtrend breakout now acts as support.
3. Price action confirmation horizontal support.
4. Forecast to broken market structure is also the Golden ratio, but that is not the same as saying a correction confirmation from structure will follow.
Is it possible price action continues correcting? Sure.
Is it probable? No.
Ww

Long OXTGood moment to try to Buy OXTUSDT. We have ready temporary low point that can be a first point in the forming new up trend. Also before we can see 3 fast move down and back days. It can be good signals that instrument to take a power for future move up. Now the good moment to take it with good risk rewards ratio. Will see...

UpdateThe only good thing about this chart is that for now price is holding onto EMA 150 support. If price loses this support and breaks below the daily EMA 150 it means you have to accept that this project is still in a bear market. For us to confirm that there’s a bull market ahead of us, price needs to break above and close above weekly EMA 150. For now, there’s a lot of uncertainty in the market. In conclusion, above weekly 150 EMA means there’s hope for bull market for this asset. Below daily 150 EMA means crabs and bears are in control. Between daily and weekly 150 EMA means uncertainty.

HUGE opportunity for $OXTThe breaking of the triangle is imminent, matter of hours/days if the trend continue in this way.
Otherwise there will be one last push back before the next ATH, don't sleep on this one.

WeakPrice keeps failing to generate higher highs, while it has done a good job of forming lower lows. Soon If price fails to break above 12 cents and stay above this level, it could mean there’s no buying pressure which would potentially drag the price down back to around 8-9 cents. This is a crucial downtrend that must be broken, because only after breaking above this downtrend, big players might pour in.

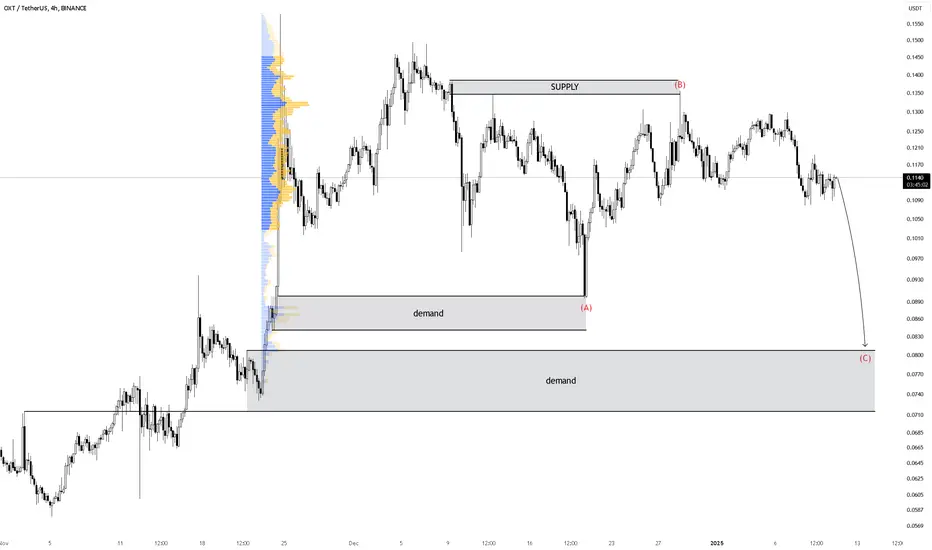
OXT Looks Bearish (4H)It seems that from the point where we placed the red arrow on the chart, OXT has entered a complex correction. This correction appears to be either a Diametric or a Symmetric pattern.
From the red zone, it can drop towards the specified targets.
Currently, it seems to be in the early stages of wave E.
When the first target is reached, make sure to secure some profits and move the stop-loss to the entry point.
A daily candle closing above the invalidation level will invalidate this analysis and the bearish outlook.
For risk management, please don't forget stop loss and capital management
Comment if you have any questions
Thank You

OXT drop and rise !#OXT hit a demand zone and now targeted a demand zone in lower prices i think this demand zone is unbreakable it can hold the market as it is made by 2 different demand lines !
Error 404OXT failed to break out of the symmetrical triangle. Price is now heading back down to the support line of the triangle. If price fails to hold onto the support, OXT will bleed out bad. We all thought alt season is here, but it’s not. And with the DXY rising it’s taking down the entire market down with it. The DXY goes, the more OXT will bleed out.

Symmetrical TriangleOXT is struggling to breakout of this symmetrical triangle, but IF price manages to break out of this structure, then the bulls will have the chance to take control of the market direction for sometime.

Super 6We are totally bullish on all higher time frames. Buy around 0.1230s range and wait for 0.1500 above.

Ascending ChannelI just made up an ascending channel. Like always, I don’t even know if this can be called an ascending channel or not, but I’m gonna assume it is an ascending channel and I think price is heading straight to the top of the channel. Price may surpass the top of the channel, but that is up for debate. Price may face resistance once it reaches the top of the channel according to past price action.

OXTUSDT (Orchid) Updated till 24-11-24OXTUSDT (Orchid) Daily timeframe range. look at the cool pump today, many alts actually formed same way and have potential of good gains. literally free money. staying above 0.1298 would make things more easy here if not than 0.0909 level and support to watch.

Ascending Broadening WedgePrice has found support on the weekly on the lower trend line of the breading wedge. I expect price to visit the top trend line of the broadening wedge which is about 33 cents which is about a 280% increase. Low market cap with increasing volume is a good sign. On top of all that, the chart has formed a massive inverse head and shoulders which increase the probability of the pop.
DYOR…

OXT WITHIN BUY ZONESCurrent price is still on a strong support level and this Level might not be visited again as buy trend would take us higher.

OXTUSDT.1DThe chart represents a daily time frame analysis of OXT/USDT (Orchid Protocol paired with US Dollar Tether) from June to early December 2024. My analysis begins by identifying a significant downtrend marked by the descending red trend line, termed R1, which highlights the resistance levels that have contained price movements since June.
Initially, the OXT price reached its high around mid-June at approximately $0.1190, and since then, it has been forming lower highs and lower lows, indicative of a bearish trend. The price tested the descending trend line in early August but failed to break through, confirming the strength of the resistance.
As of now, in early August, the price is attempting to stabilize above a support level, S1, marked at $0.0625. This support level is critical because it represents a previous price consolidation area from late July, suggesting it could be a potential reversal zone. However, if the price fails to sustain this level, it could fall towards the next support, S2, at $0.0535, which would align with the continuation of the existing bearish trend.
Looking at the technical indicators (not shown in the chart but typically used in such analysis), if the Relative Strength Index (RSI) is trending towards oversold conditions, and the Moving Average Convergence Divergence (MACD) shows a potential bullish crossover, it could indicate an impending bullish reversal or pullback.
To conclude, my current strategy would be cautious. I would monitor if the price can maintain above the S1 level and look for any bullish signals in the indicators to consider a long position. Otherwise, if the price breaks below S1, I would prepare for a potential short position, targeting the S2 as the next support level. As always, it’s crucial to place stop-loss orders to manage risk effectively in such volatile markets.

OXT / USDT enter After Retest 0.0700 Zone
Take Profit On Pink Boxes As Much You Can
Stop Loss Keep Under The Sold Green Support Line.
Safe Trade.
Regards
Sheikh Mohsin
crypto Learners

OXTUSDTWe can attempt to buy OXTUSDT from specified level as it make HL , also 0.5 FIB level intact indicate that it moves upward.
SL , TP mention in chart.
