IH&S for PEPE possibleBTC is in the middle of the parralel channel and tends to go down. So this IH&S for PEPE is an early call and for sure not tradeble yet.
But I will keep an eye on the charts because if this pattern plays out it can give us 14% up.
DYOR - this is just someting i noticed.
PEPEUSDT.P trade ideas

Major Shift for #PEPEUSDT: Prepare for a Potential Breakout! Yello, Paradisers! Have you noticed the intriguing shift in #PEPEUSDT? It’s gearing up for a breakout from its descending channel, setting the stage for an exciting potential bullish surge.
💎Over an extended period, #PEPE has meticulously traced the contours of a descending channel. Currently, the price is testing a critical support level at $0.00001075. If the price manages to sustain momentum here, there is a great probability of a bullish ride. However, prudent preparation is crucial. Should the price of CRYPTOCAP:PEPE dip below this pivotal support zone, we may witness a pronounced bearish downturn.
💎In such a scenario, our focus shifts to anticipating a bullish rebound from the lower demand level at $0.00000890. Breaking below this demand level could invalidate the bullish setup and cause the price to drop significantly.
💎Trade smart, Paradisers! If you are serious about trading and care about your capital, avoid reading crypto Twitter. We’ve seen many expert traders fall into the herd mentality because of it. Be disciplined with your trading strategy and keep mastering your willpower. If you just do this, you will already be 80% better than everyone else.
Strive for consistency, not quick profits. Treat the market as a businessman, not as a gambler.
MyCryptoParadise
iFeel the success🌴

Professional trading signal analysis!Hello, guys
PEPEUSDT is currently trading at the bottom of a well-defined price channel. This suggests a potential buying opportunity, as the pair is poised for an upward movement according to recent technical patterns and Fibonacci retracement levels.
Channel Analysis:
- Support:PEPEUSDT has consistently found support at the lower boundary of the channel, indicating strong buying interest at these levels.
- Resistance:The upper boundary of the channel has served as resistance, but a breakout is anticipated soon.
Fibonacci Retracement:
- Using Fibonacci analysis, the 1.618 extension level projects a target of 0.0002211. This level is often associated with significant price movements and serves as a key target for bullish trends.
Conclusion:
Given the current position at the bottom of the channel and the Fibonacci target, we expect PEPEUSDT to achieve the 0.0002211 level soon. Traders should look for confirmation with volume and momentum indicators to support this bullish scenario.
Trade Idea:
- **Buy Zone:** Near the bottom of the channel.
- Target: 0.0002211 (Fibonacci 1.618 level).
- Stop Loss: Just below the channel support to manage risk.

PEPE BEAR ABC ANALYSISIt is about reading the price pattern and the result of the indicators
I only share with you what the analysis results show.
It can be wrong. MD


PepeUsdt
PEPEUSDT is currently trading at the bottom of a well-defined price channel. This suggests a potential buying opportunity, as the pair is poised for an upward movement according to recent technical patterns and Fibonacci retracement levels.
Channel Analysis:
- Support:PEPEUSDT has consistently found support at the lower boundary of the channel, indicating strong buying interest at these levels.
- Resistance:The upper boundary of the channel has served as resistance, but a breakout is anticipated soon.
Fibonacci Retracement:
- Using Fibonacci analysis, the 1.618 extension level projects a target of 0.0002211. This level is often associated with significant price movements and serves as a key target for bullish trends.
Conclusion:
Given the current position at the bottom of the channel and the Fibonacci target, we expect PEPEUSDT to achieve the 0.0002211 level soon. Traders should look for confirmation with volume and momentum indicators to support this bullish scenario.
Trade Idea:
- **Buy Zone:** Near the bottom of the channel.
- Target: 0.0002211 (Fibonacci 1.618 level).
- Stop Loss: Just below the channel support to manage risk.
---
Disclaimer: This analysis is for informational purposes only and should not be considered financial advice. Always do your own research before making any trading decisions.

PEPE - NO CONTEXT - UPDATE
I have a god feeling that we are in a wave 4 formation and I think it will be a Running Triangle for the fact that we have seen 150% extension for it wave B- but I am not disregarding the fact that we could get other variation such as a Flat, Running Flat or an Extended Flat. Either way we will see BINANCE:PEPEUSDT losing at least 10-20% in coming weeks. (see previous analysis for context)
OTHER ANALYSIS
BINANCE:ARBUSDT
BINANCE:PEOPLEUSDT
BINANCE:RSRUSDT
BINANCE:NEARUSDT

Alikze »» PEPE | Support of the bottom of the ascending channelAt 8h, it is in the trading range area, which has good reactions to the supply and demand areas.
💎 Currently, it is moving to the supply zone in an upward channel, which has faced a temporary correction after the negative reaction to the zone. But if it maintains the area of 0.00000894, it can break the supply area and continue its growth until the next supply area.
💎 Alternative scenario: In addition, if the bottom of the channel breaks the indicated area, it can continue to correct the demand area.
»»»«««»»»«««»»»«««
Please support this idea with a LIKE and COMMENT if you find it useful and Click "Follow" on our profile if you'd like these trade ideas delivered straight to your email in the future.
Thanks for your continued support.
Sincerely.❤️
»»»«««»»»«««»»»«««

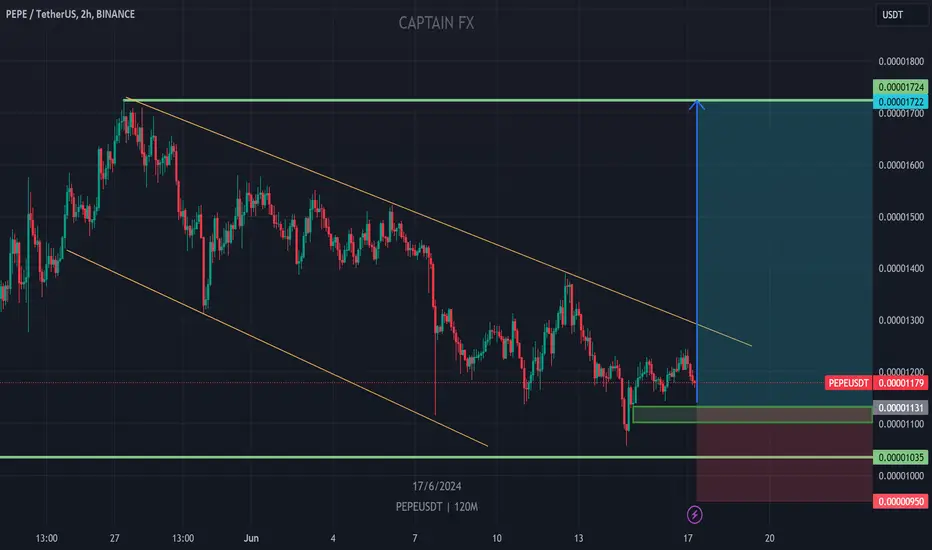
PEPE/USDT TO 0.00001724 BUY NOW!!!!!!!PEPE completed 0.000012 after making a bounced from the sell side liquidity at 0.00001038 now price is making a possible retracements from 0.00001131 to take off on another rally am going in on a buys from that zone till target 0.00001724 is completed
TELL US YOUR VIEWS ON PEPE
PEPE SPICY CHARTPEPE Followed my previous setup, but I am not satisfied yet. I was waiting the price to hit the support area at 0...105 and still think we will see the price there probably in the next few hours/days. This can be a good level to enter longs, and I expect a pullback at this level targeting new local highs.

IH&S PEPE neckline reached and declined for nowWhile BTC drops the neckline of the IH&S rejects for now.
We would love to see some volume in the outbreak up and a nice retest in order to start a potential trade.
The more risky early entry would have been a great call now we have seen this nice uptrend. Let see of that can lead to the real trade.
No financial advice

pepe → a 350% profit opportunityhello guys...
let's analyze pepe...
I think pepe is bullish and it will touch the $0.000041 area! but why?
1- the price is forming a rising 3 drives pattern.
2- a predicted ascending channel.
3- an internal trendline formed.
so I believe the price will react to the blue area and then will touch the bottom line of the channel to go the target area ($0.000041)!
___________________________
✓✓✓ always do your research.
❒❒❒ If you have any questions, you can write them in the comments below, and I will answer them.
❤︎ ❤︎ ❤︎And please don't forget to support this idea with your likes and comment

PEPEUSDT 8HFalling wedge pattern on the #PEPE 8H timeframe. In case of a breakout, the targets are:
$0.00001313
$0.00001435
$0.00001534
$0.00001633
$0.00001773
$0.00001952

PEPEUSDT IDEAHello Traders Hope You Are Enjoying Our Analysis. Today We Will Discuss About PEPE
(Update)
PEPE Is Running Inside The Falling Wedge☑️
In Case Of Successful Breakout Expecting Massive Bullish Wave⚡️

PEPEUSDTPEPEUSDT is in strong bearish trend.
As the market is consistently printing new LLs and LHs.
currently the market is retracing a bit after last LL, which is 50% Fib retracement level and local support as well. if the market successfully sustain this selling confluence the next leg lower could go for new LL.
What you guys think of this idea?


#PEPE / A definite condition for 50% growth!The clearest and most accurate condition for the growth of PEPE is the breaking of the 1314 resistance in the 4-hour time frame.
Please note that this condition remains until this currency cannot be stabilized under the support of 1116
The targets are indicated in the figure

PEPEUSDT IDEA #PEPEUSDT
Hey dear traders hope you are enjoying trading and analysis with our team. we are here to discuss about PEPEUSDT
PEPE is making Falling wedge formation in 3h time frame ✅
In the case of successful breakout Expecting massive Bullish wave 🚀

PEPEUSDT.1DIn this technical analysis of the PEPE/USDT chart, we delve into the patterns and indicators that might signal the cryptocurrency's future market movements.
Key Observations:
Current Price and Performance:
The chart shows a current price of $0.0001033 for PEPE/USDT, having declined by 7.52% on the day.
Support and Resistance Levels:
R1 (Resistance Level 1): $0.0000865 - This level may act as a near-term ceiling, and breaching this could signify bullish momentum.
R2 (Resistance Level 2): $0.0001377 - Surpassing R1 could open the path towards this higher resistance.
S1 (Support Level 1): $0.0000595 - This is the immediate support where price might stabilize following any further declines.
S2 (Support Level 2): $0.0000399 - A critical lower support, which if breached, may lead to new lows.
S3 (Support Level 3): Not clearly defined in the current scope but inferred to be lower based on the chart pattern.
Technical Indicators:
MACD (Moving Average Convergence Divergence): Currently in a bearish phase as indicated by the histogram below zero and a downward trajectory in the MACD line.
RSI (Relative Strength Index): At 47.65, this positions the asset in a neutral zone, neither overbought nor oversold, indicating potential for movement in either direction.
Technical Strategy and Conclusion:
The PEPE/USDT market appears to be in a bearish trend as indicated by the decline in price and MACD’s bearish signal. The current chart setup suggests a consolidation phase might be occurring, with potential support at S1. A rebound from this level could target the R1 resistance; however, traders should remain cautious as the bearish momentum might continue if support levels are breached, particularly S2.
In the short term, watching for a consolidation around S1 or any bullish signals, such as a crossover in MACD above the signal line, could be key. Investors should prepare for multiple scenarios: a rebound towards R1 or further declines towards S2. Market sentiment and upcoming financial news should also be monitored closely as they can heavily impact the price dynamics of cryptocurrencies like PEPE.
This analysis serves as a framework based on the current technical setup, and it is crucial for traders to stay updated with real-time data and adapt their strategies accordingly.

PEPE/USDT Falling Wedge Formation Formation-Bullish SignalDear Traders,
We are convening a discussion focused on #PEPEUSDT
The Falling Wedge Pattern is Formed
Now it's Ready to Break the Pattern
In Case of Successful Breakout, Expecting a Bullish Move of 25-30%🚀😉
#crypto #cryptocurrency #bitcoin #ethereum #blockchain #btc #cryptotrading #cryptonews #eth #cryptocurrencies #nft #bitcoinnews #bitcoins #trading #bitcoinmining #forex #binance #cryptoart #nfts#trading #forex #trader #investing #stocks #forextrader #stockmarket #daytrader #forextrading #invest #bitcoin #daytrading #cryptocurrency #crypto #investor #investment #forexsignals #nse #chartpattern #cedarforex #candlepatterns #learntrading #bseinstitute #shorttermtrade #bankniftytrading #stockmarketph #calloptions #mqlsignal #futuretrader #tradingmemes #chartpatterns #tradingview #tradinglife #tradinglifestyle #tradingstrategy #tradingtips #tradingplan #tradingsignals #tradingaccounts #tradingsignal #tradingforex #tradingsync #tradingroom #litecoin #ethereum #bitcoincash #cryptocurrencies #ripple #btc #bitcoinnews #bitcoinmining #blockchain #eth #bitcoin #bitcoins #coinbase #cryptocurrency #crypto #bitcointrading #dogecoin CRYPTOCAP:BTC CRYPTOCAP:ETH CRYPTOCAP:USDT CRYPTOCAP:PEPE CRYPTOCAP:DOGE NASDAQ:ALT


PEPE / Fastest Confirmation of Growth Start - How?Trade it earlier than others
There are 2 strong possibilities for the future growth of this currency
First: growth from here and break of 1238 resistance in 15 minutes time frame
The second: the continuation of the fall until the support of 1128-1116 and the construction of the HIGH on this area
Which do you think is more likely?
Targets are marked in the figure

"HIGH ALERT"#PEPE last chance before the GREAT FALLSIMO pepe will find support @ 1030-1079 area
this may be the last change for the bulls before expecting major top either the areas of
18-19
227-247
so trade carefully at the defined areas
