ATRL - PSX - Reversal PatternATRL - PSX in bullish trend depicted Double Top Reversal Pattern indicating Declining Phase.
ATRL trade ideas

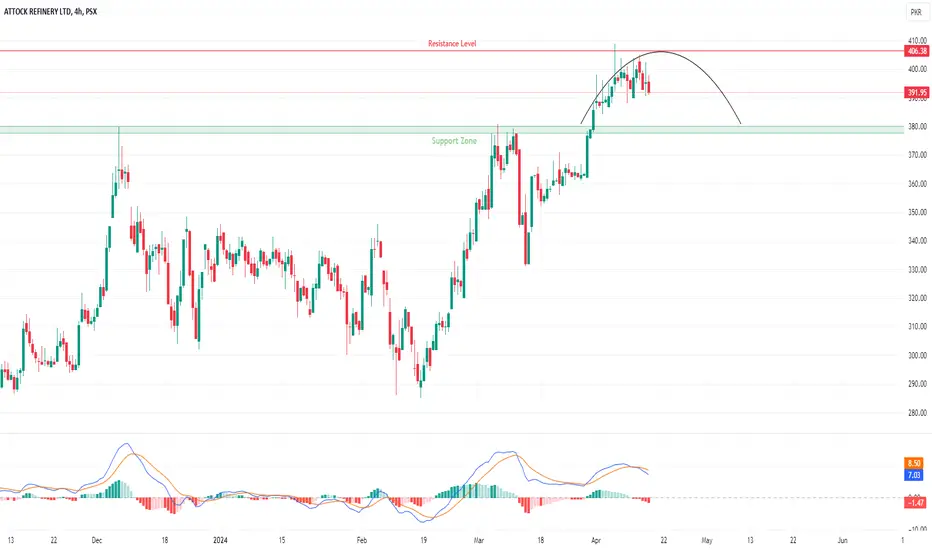
ATRL | Bearish CUP formatInverted Cup is a fairly rare but very reliable bearish pattern. It is formed at the end of a long-term bullish trend and usually gives a signal of a market reversal.
The upward trend in prices with a gradual slowdown. In the classical case it should represent a smooth arc.
A rounded bottom is, in simple terms, a dumping of a position by large market participants, when the price is very difficult to keep from falling. When it can no longer be done - phase 3 of the formation begins (i.e., the fall)
The descending of the price - the maximum if followed by the descending, which should be the entry point, and should last as long as the first phase (the price ascending)
MACD shows cross over from the top which also gives bearish signal.
For a long position, better to wait for the completion of the cup formation around 180 which is the support level of the price and a pull back for its handle can be considered for a gain.
On the flip side, if the price breaks and sustains its resistance level of 406 then this formation will be failed and the new bullish cycles may develop.
ATRL | Double Top Breaks!Break out from the double top pattern is observed in ATRL that creates new opportunities on the reset of previous resistance acts as support around 380. It is recommended to keep an eye on todays closing and enter on the retest of around 380.

ATRL | Bearish divergenceATRL | Bearish Divergence | ATRL showing bearish divergence on daily time frame with the shooting star candle generate in the previous trading session. This indicates rejection in its price. Profit taking is recommended in this stock. Exercise caution and monitor closely.🛑


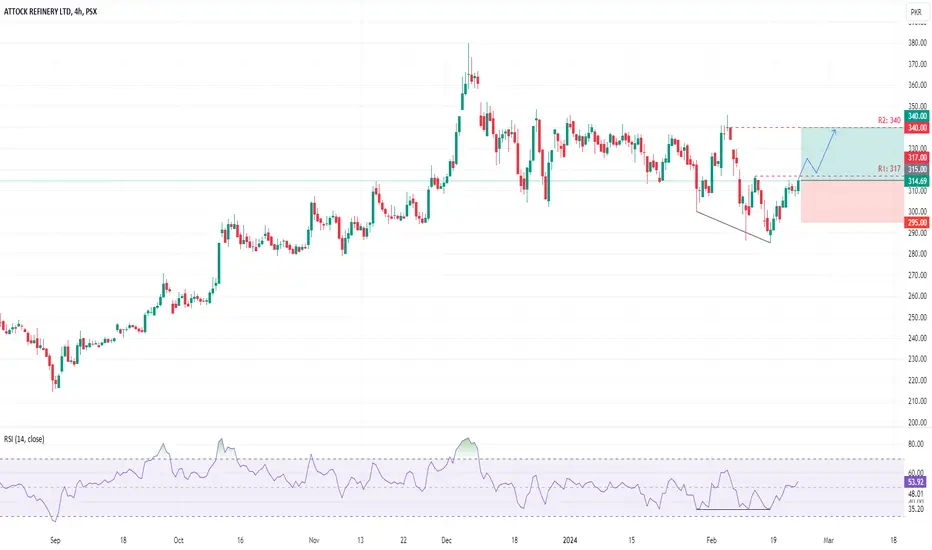
ATRLAfter the bullish divergence observed in Attock Refinery share. The price action is currently testing resistance level of around 317 which breach and sustains can pull the price towards next resistance of 340. Stop loss can be placed below 295.
ATRLATRL Buy at HL (also 0.5 FIB , trendline support intact)
For confirmation , bullish candle made at 4 hour time frame
Buy 1 at 325.5
Buy 2 at 309.23
SL 276.94
TP 369.37
RR 1.3

Ascending TriangleBuy Above 317.50
Sell around 326 - 327
if 330 is Sustained, Trail your stoploss for TP 340 - 345
Stoploss 304 (Closing Basis)
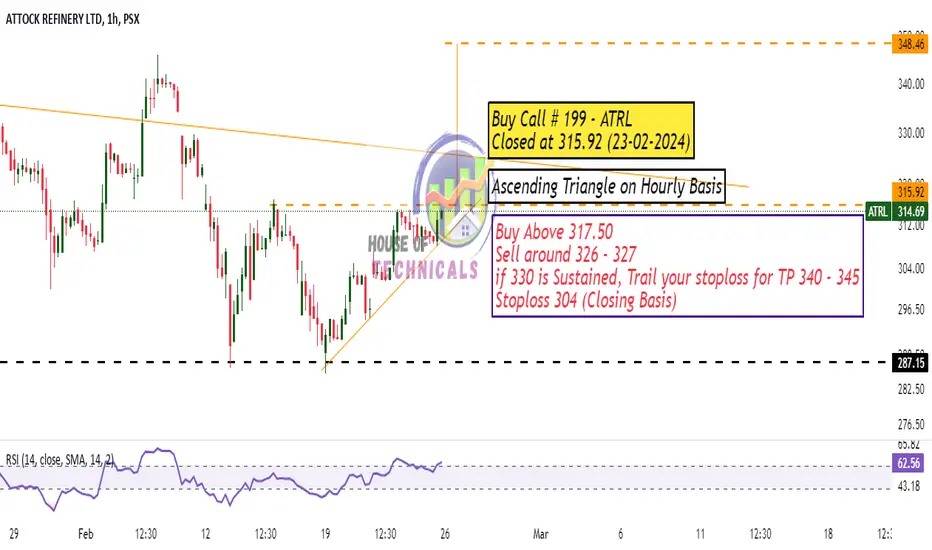
Re-Test of Breakout LevelBullish Divergence on Hourly TF
Re-Test of Breakout Level
0.382 fib level support around 282 - 283
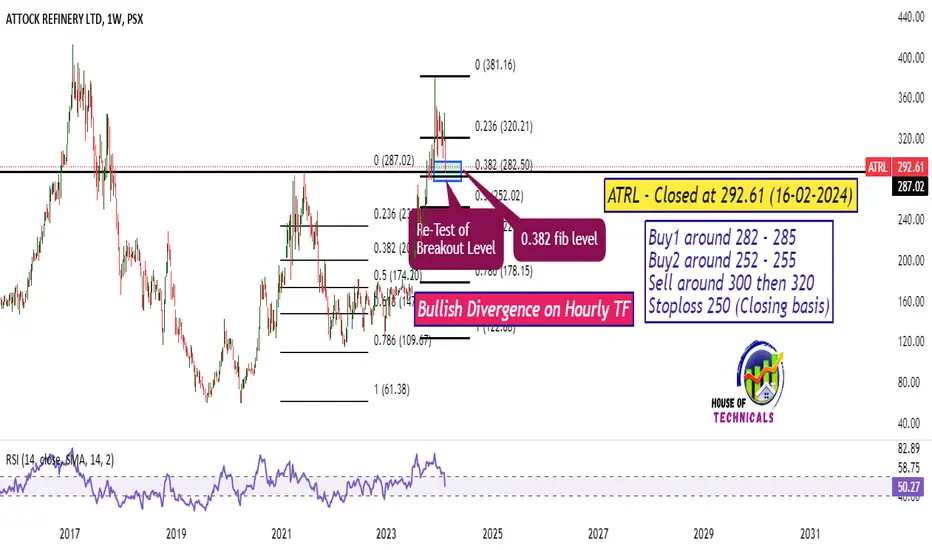
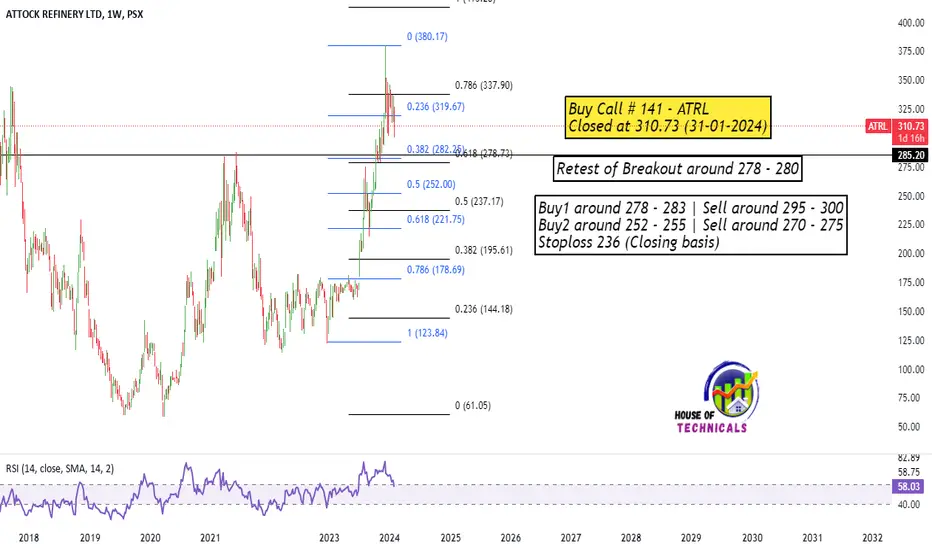
ATRL - Retest of Breakout PossibleBuy1 around 278 - 283 | Sell around 295 - 300
Buy2 around 252 - 255 | Sell around 270 - 275
Stoploss 236 (Closing basis)
ATRL🚀 Stock Alert: ATRL
📈 Investment View: Technically Bullish 📈
🔍 Quick Info:
📈 Entry Range: 336
🎯 Targets : 380
⚠ Stop Loss: 314
⏳ Nature of Trade: Short Term (Scalping)
📉 Risk Level: Medium
☪ Shariah Compliant: YES
💰 Dividend Paying: YES
📰 Technical View: Establishing bullish momentum, if it break and sustain resistance level of 350 then it can test 380. Stop loss can be placed below 314.

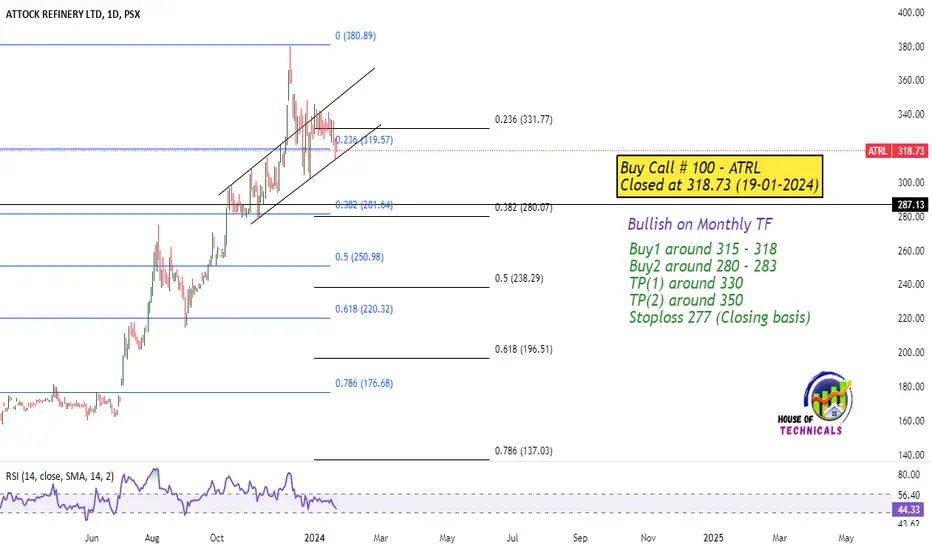
ATRLBuy1 around 315 - 318
Buy2 around 280 - 283
TP(1) around 330
TP(2) around 350
Stoploss 277 (Closing basis)
ATRL - PSX - Bullish PatternATRL has formed a bullish flag pattern on the daily chart, RSI is not showing any divergence, entry can be taken at the breakout of the flag pole with targets at 1:1 and 1:2 risk reward, which are coinciding with the flag projection.

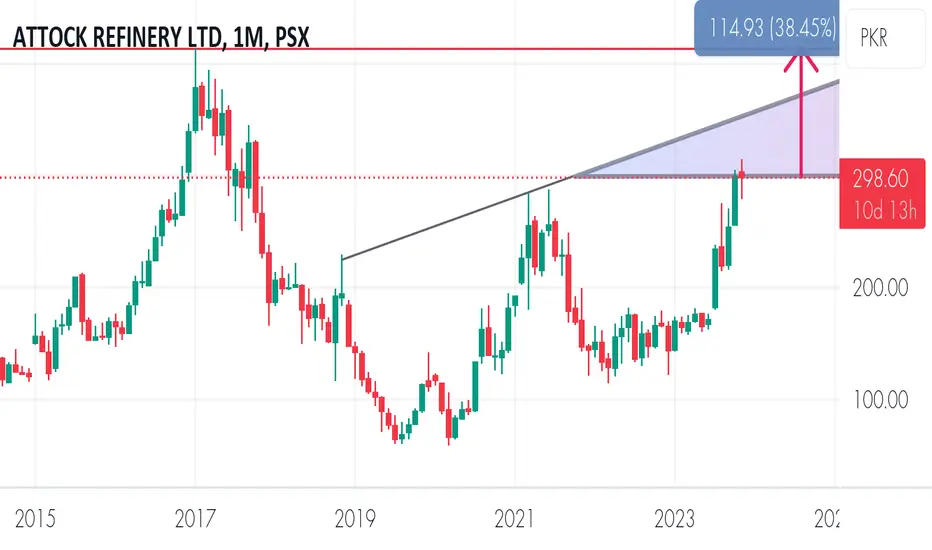
ATRLAre you ready for 38.45% of gain in the most hot traded item. This idea is for swing traders. Hold your long position for better returns.
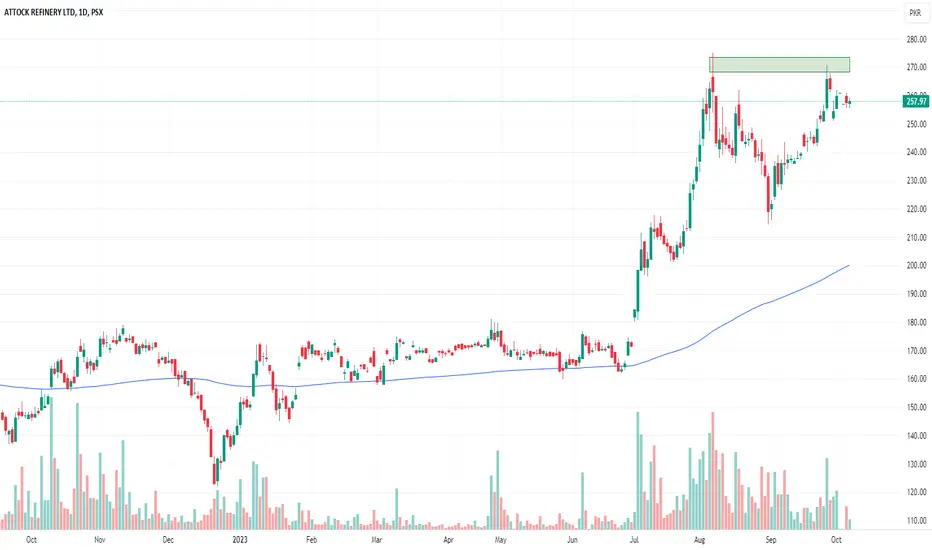
Double Top Pattern or Break OutATRL shows rejection after testing the resistance level around 270. If this level fails to break, there is a likelihood that the price may test the 200 EMA (Exponential Moving Average) around 220.
ATRL Bullish Flag Breakout ContinuationATRL Bullish Flag Breakout Continuation
ATRL - BULLISH FLAG BREAKOUT CONTINUATION TARGETING 275/-

ATRLATRL has broken its bullish flag pattern with high trading volume, aiming for the first resistance at 261, followed by 275 if it breaks the first. The initial support is at 236, with a secondary support near 218 in case of a reversal.

ATRL - BULLISH ABCDATRL was in a bull trend when it retraced till 0.5 Fib level. It has bounced from there and is likely to continue bull trend completing the final target of ABCD pattern.

PSX: ATRL Short CallThe script , after a bull run, is under selling pressure. This can be a great opportunity to reap the profit. So let's trade as per plan.

ATRL - BULL FLAGATRL is forming a Bull Flag indicating continuation of the trend. Breakout on long side is probable as there is no divergence and long trade may be planned
