ROSEUSDT IDEAHey traders hope you are enjoying our analysis. Now we are here again with a new trading opportunity. We will discuss today about OM
OM Moving To Good bullish wave the Target Running In +30% Profit So Far ✅
Expecting 40% in few hours 🚀
ROSEUSDT.PS trade ideas

ROSEUSTD UPDATE#ROSEUSDT(Update)
Hey dear traders. Hope you are enjoying analysis with our team. we are here to analyze ROSEUSDT today.
Running towards our target.
11% profit done✅
Expecting more in coming days🚀

ROSEUSDT UPDATE #ROSEUSDT
UPDATE
Hey dear traders hope you are enjoying trading and analysis with our team. we are here to discuss about ROSEUSDT
Moving Exactly AS we Expected
10% profit done ✅
Expecting massive Bullish wave 📈

ROSEUSDT Primed for Major Bullish Surge:75% Upside Potential!The ROSEUSDT trading pair is showing strong signs of an impending bullish wave, presenting a compelling buying opportunity for traders. With technical indicators aligning, there is a potential target upside of 75%. As always, it’s crucial to implement a stop-loss strategy to manage risks effectively.
ROSEUSDT (1D Chart) Technical analysis
ROSEUSDT (1D Chart) Currently trading at $0.105
Buy level: Above $0.104
Stop loss: Below $0.89
TP1: $0.115
TP2: $0.135
TP3: $0.155
TP4: $0.185
Max Leverage 3x
Always keep Stop loss
Follow Our Tradingview Account for More Technical Analysis Updates, | Like, Share and Comment Your thoughts

ROSE/USDT showing sign of strong bullish move? 💎 Ladies and Gentlemen of ParadiseClub! Keep your eyes on #ROSEUSDT as it shows promising signs of a bullish continuation from the demand zone, following a breakout from descending resistance.
💎 A closer look reveals that the Bollinger Bands are tightening, typically a precursor to a significant upward movement. Currently, the price of #ROSE suggests an increased likelihood of a bullish trajectory from the demand zone at $0.08980. Should it maintain this momentum above the EMA 100, we could see a strong bullish push towards the next supply area.
💎 The ascent is likely to begin once the price successfully overcomes the supply area and sustains its upward momentum. However, it's crucial to consider alternative scenarios: if BCBA:ROSE cannot break the descending resistance and begins to fall, a bullish recovery from the lower support zone at $0.08003 might occur. Nevertheless, a fall below this level could undermine the bullish scenario, potentially leading to further declines.
MyCryptoParadise
iFeel the success🌴

ROSEUSDTWe can attempt to buy ROSEUSDT from specified level if it break LH , trendline resistance , also bullish divergence occur indicate that it move upward.
SL , TP mention in chart.

ROSEUSDT #ROSEUSDT
UPDATE
Hey dear traders hope you are enjoying trading and analysis with our team. we are here to discuss about ROSEUSDT
Falling wedge Breakout done in 1D time frame ✅
Expecting 60% profit in coming days 🚀

ROSEUSDT IDEAHello Trading view Family / Fellow Traders.
I hope you have used and benifited from the previous analysis .
In today trading session we are monitoring ROSEUSDT for a buying opportunity,
ROSEUSDT UPDATE
#Rose is ready for a good bullish wave after successful breakout in this move we can see price around 0.13000$ ✴️
Maximum chance to gain +40% profit💸 in coming days 💯✅

ROSEUSDT IDEAHey traders hope you are enjoying our analysis. Now we are here again with a new trading opportunity. We will discuss today about ROSE
ROSE The Bearish Pennant Breakout has Already Done in 12H Time frame✍️
Expecting 40% Bullish wave 🚀

Rose Rose coin liquidatind daily candle and bouncing back from support ,
Perfect time to buy rose as bull run approaches 📈📈

ROSEUSDT UPDATE#ROSEUSDT(Update)
Hey dear traders. Hope you are enjoying analysis with our team. we are here to analyze ROSEUSDT today.
Falling wedge Breakout Done in 1D time frame.
Retesting is in process✍
Expecting more in coming days📈🚀

ROSEUSDT, Updated analysis, Never miss this opportunityWelcome, Trader. Welcome to our crypto community! 🚀We are delighted to welcome you, whether you are an experienced trader or new to cryptocurrency.
We are willing to discuss #ROSEUSDT💹.
#ROSEUSDT 🔥🚀
___________
Update:
Time Frame: 8 Hr
➡️ ROSEUSDT formed a bullish Peanut pattern.
➡️ Breakout confirmation is already done. 🚀.
➡️ Retest confirmation is already done.
➡️ We anticipate around 58% in the near future. 👉✅.

$ROSE Limit longBCBA:ROSE limit long. As most of crypto is bottoming out, this looks like a very good RR. I suspect if this hits, it will be last time this price will ever be this low. Time for ATH

ROSEUSDT IDEAHello Trading view Family / Fellow Traders.
I hope you have used and benifited from the previous analysis .
In today trading session we are monitoring ROSEUSDT for a buying opportunity,
ROSEUSDT UPDATE
#Rose is ready for a good bullish wave after successful breakout in this move we can see price around 0.12500$ ✴️
Maximum chance to gain +35% profit💸 in coming days 💯✅

OASIS Rose Technical Analysis and Trade IdeaOn the daily timeframe, we observe a double bottom formation that has experienced a spike below into liquidity. This situation suggests the potential for a trend reversal. If this scenario unfolds, there's an opportunity to buy at a substantial discount and capitalize on an early entry before a bullish rally (assuming my analysis proves accurate). In the video, we delve into trend analysis, market structure, price action, and other critical aspects of technical analysis. I share my perspective on accumulating and entering this market, emphasizing the importance of prudent risk management. Remember, this content is purely educational and not financial advice. 📈🚀🔍

ROSEUSD 12HROSE ~ 12H
#ROSE We pay attention #ROSEUSD This chart looks interesting for the 12H time frame.
In terms of pattern, BCBA:ROSE has succeeded in breaking through the resistance of this pattern.

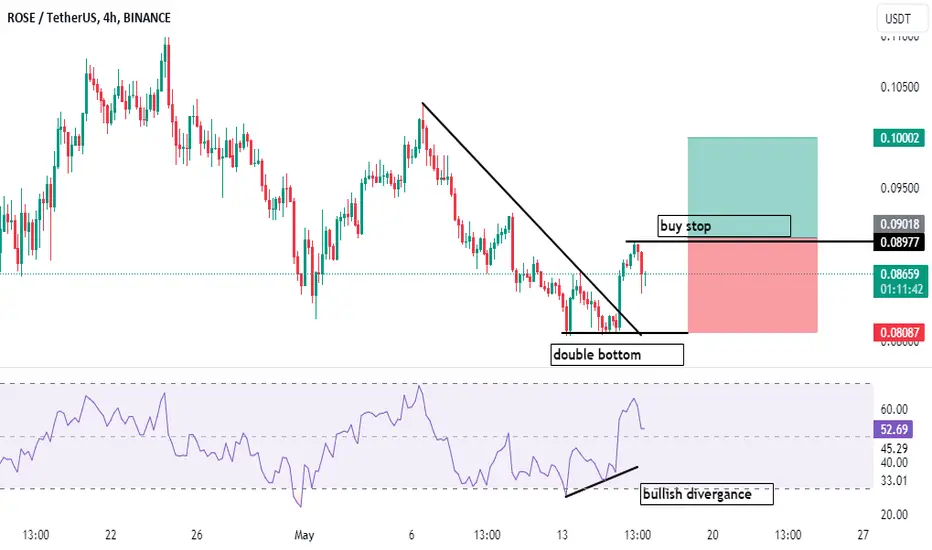
ROSEUSDT ROSEUSDT is showing bullish divergence place a buy stop at 0.09018 as it break its Last LH plus Double bottom pattern neckline along with trendline
ROSE, may target back above 0.080 soon after 61.8 FIB touch.ROSE on daily data is showing some significant accumulation / net buying after touching the 61.8 FIB LEVEL.
It clearly bounces off that significant level with accuracy. Expect a reversal to the upside from the current price range:
Spotted at 0.0620
TAYOR.

ROSEUSDT IDEAHello Traders Hope You Are Enjoying Our Analysis. Today We Will Discuss About ROSE
(Update)
The Descending Channel Formation In 1D Timeframe✅
In Case Of Successful Breakout Expecting Massive Bullish Wave✍️

ROSEUSDT 12H#ROSE is moving above the MA50 on 12H timeframe. It is testing the descending channel resistance and Ichimoku cloud. In case of a breakout, the targets are:
$0.11529
$0.12860
$0.14191
$0.16086
$0.18500
Wait for the breakout and then enter.

🚩🚩Test only for studyTest chart for practice only
This chart not for entry only saving to see how wrong is my drew
Thanks

Oasis Network (Rose)If we look at the Rose behavioral patterns, it looks like a sinusoidal wave in which the amplitude is increasing logarithmically. So, doing simple math, when the next sinusoidal wave starts it has to go up about 2000% 😵
What do you think?

ROSE 1D Double bottom formingGreen box OB has held well
Double bottom forming
possible reversal toward the upside
Targeting key resistance levels marked out as yellow, orange and red dotted lines.
