SANDUSDT.P trade ideas

Alikze »» SAND | Pullback to broken structureThe Sandbox is a blockchain-based platform that offers creative and decentralized gaming experiences. SAND combines DAO, Metaverse, and NFTs to usher in a new era of gaming.
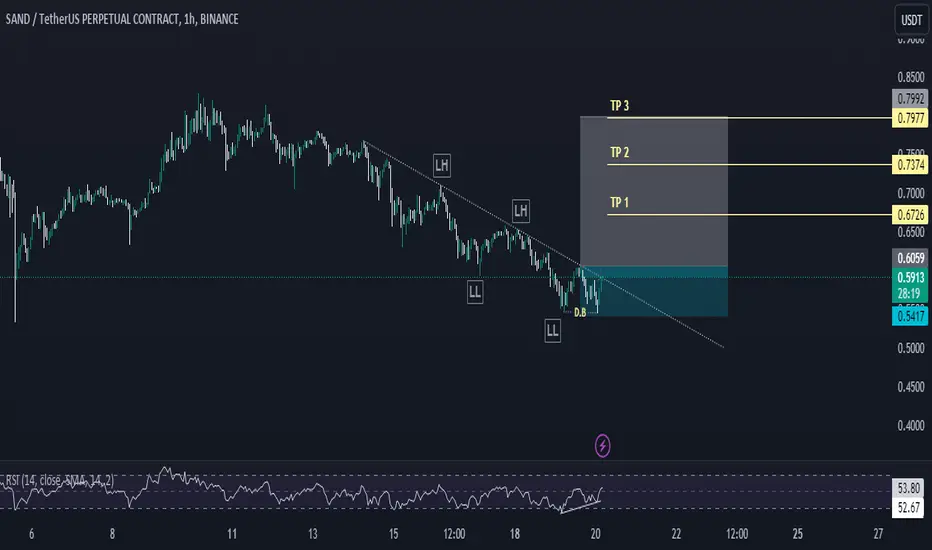
🔰 In the weekly time, it has made a mixed correction, which after 50% correction of the previous wave has faced demand in the range of 0.27, and now with the failure of the dynamic trigger and a correction and a pullback, it has a growth up to the supply area and neck line. Therefore, I expect that after completing the corrective lag, it will face demand and advance towards the target.
⚠️ The invalidity zone of the analysis is the range of 0.39, and penetration and stabilization below that analysis will be invalidated.
»»»«««»»»«««»»»«««
Please support this idea with a LIKE and COMMENT if you find it useful and Click "Follow" on our profile if you'd like these trade ideas delivered straight to your email in the future.
Thanks for your continued support.
Sincerely.❤️
»»»«««»»»«««»»»«««

Bearish SANDUSDT confirmed with a strong bear daily stickSince there was a big bullish rally for the recent month crypto market is in a starting of bearish trend, the first clue for bear run is given and the retest of the same is happened this bear run will be shorter than the last time. Entry point is between 6900-7000 and Take profit is at 5600-5700. This can be taken as a swing trade or day trade as ur wish.

$Sand SAND rounded bottom Formation....NYSE:SAND price action is currently forming a rounded bottom
Current price: 0.71
Sand Price is currently at a major resistance btw 0.71 - 0.8 (not broken since 2022!)
A break above this key resistances will lead to up resistances: 1.1, 1.4, 1.7, 2.0, 2.3, 2.6, 3.0, 3.4
Continuous rejection at this major resistance will make for buy the dip levels at support 0.42
#sand #2sydes

Sandusdt trading opportunitySANDUSDT has achieved a significant milestone by reaching the $8.45 level, which currently stands as its all-time high (ATH). This follow with a substantial correction, with the price plummeting to $0.2763. Our analysis suggests that this price point may serve as the provisional bottom for the current market cycle.
In addition to our findings, we have been monitoring a trendline that has historically acted as a dynamic resistance throughout the correction phase. Notably, this trendline has recently failed to suppress upward price movement, with SANDUSDT breaking out above it. The price has stabilized, indicating a potential shift in market sentiment.
We anticipate a retracement back to this now-supportive trendline, which we consider an opportune moment for long position accumulation with stop loss just below the $0.2763 level to mitigate potential losses should the market take an unexpected downturn. The specific price targets for taking profits were provided on our chart.
We value your interaction with our analysis. Please support our work by liking this post and share your perspectives in the comments section.
Thank you for your engagement.

#SANDPartially gained a position in #SAND with a target of $4. (+~500%)
I am waiting for the "Head and Shoulders" pattern to work out after which the price should break the global downtrend.

TAKE A LONG ON SAND USDT ,DETAILS ATTACHED@DonbitUsing my sniper precesion technolgy the arrows have shown up,the restistance and support box checked.Therefore i have taken the trade

An inverse head and shoulders pattern is seen - SANDUSDTTrading Setup:
There is a Trading Signal to Buy in SANDUSDT SAND (4h)
Traders can open their Buy Trades NOW
⬆️Buy now or Buy on 0.6092
⭕️SL @ 0.5333
🔵TP1 @ 0.8144 ( Inverted H&S Pattern Target )
🔵TP2 @ 1.0000
🔵TP3 @ 1.2886
What are these signals based on?
Classical Technical Analysis
Price Action Candlesticks Fibonacci
RSI, Moving Average , Ichimoku , Bollinger Bands
Risk Warning
Trading Forex, CFDs, Crypto, Futures, and Stocks involve a risk of loss. Please consider carefully if such trading is appropriate for you. Past performance is not indicative of future results.
If you liked our ideas, please support us with your likes 👍 and comments .

3% Quicky Just not for me but also who catches this post atm: trend-out with confirmation just observed. Set your SLs (multiple) accordingly.

Long position sandSo the daily support line hold.
We made a higher low on 1h timeframe.
Now I am looking to come back to the golden pocket to go further up.
Let’s see what happens.

SAND long-term investment
I am initiating purchases of SAND in this region. From a technical analysis standpoint, prices currently hover just above a robust support level, indicating significant potential for upward momentum in the coming weeks.
Key technical indicators include:
Consolidation above the Fibonacci level 0.5.
The Tenken Sen has recently crossed above the Kijun Sen, signaling a confirmed uptrend. These indicators are bolstering the current price action.
Furthermore, the price has recently breached the Ichimoku cloud, undergone a retest, and appears poised for a potential rebound.
In the fundamental side, it's worth noting that discussion surrounding the Metaverse has been relatively quiet for some time. This presents an opportunity for market makers to generate renewed excitement and hype around the concept, potentially catalyzing significant interest in SAND this year.
Disclaimer:
This analysis is based on my personnal views and is not a financial advice. Risk is under your control.
--- About SAND ----
SAND tokens are used within the Sandbox ecosystem for various purposes, including purchasing LAND, ASSETS, and participating in governance decisions. Additionally, creators can earn SAND by designing and selling virtual content within the Sandbox platform.

SAND ANALYSIS🚀#SAND Analysis :
🔮As we can see in the chart of #SAND that there is a formation of Descending Channel Pattern. #SAND breaks descending channel recently.....currently retesting the zone. Incase of successful retest.....we can expect 2-3x bullish wave in coming weeks📈📈
🔰Current Price: $0.6084
🎯 Target Price: $0.8588
⚡️What to do ?
👀Keep an eye on #SAND price action. We can trade according to the chart and make some profits⚡️⚡️
#SAND #Cryptocurrency #TechnicalAnalysis #DYOR

🔥 SAND Bullish Channel Signal: Ride The WavesAs seen on the chart, SAND has been trading inside a well-defined bullish channel pattern for almost 6 months at this point.
This signal is based on the idea that SAND will continue to trade within the channel and will bounce from the bottom support.
Stop just below 0.50$, target at 1$ to create a very decent trade with high RR.

memories of a bull market in Metaverse tokens .... #SAND has a inverted head & shoulders in the works
That has some nice targets
SEcond cycle
so it in most likelihood it falls short of the previous high as is customary for altcoins
but the previous cycle's action is enough to attract speculative capital into these type of coins
to ride a memory pump
there you go.

SAND/USDTEverything is clear in the chart
After rising and correcting, the price is set at Fibonacci 61 and I am waiting for the daily candle to close

SANDUSDT-LONG IDEASANDUSDT has formed double bottom with bullish divergence which could be a reversal point for sandusdt if the recent lower higher gets broken then it will be confirmed put buy stop order above the recent high.
SANDUSD 1WSAND ~ 1W 📈
#SAND Pay attention to this resistance line, you can start making purchases after this resistance line is successfully broken. With a minimum target of 20%+.
Attention, active buying after this resistance is successfully broken

Critical Situation for SANDIn weekly timeframe SAND need to reach $0.48 orderblock.
if this orderblock unable to hold the price, $0.23 is probably hold it.

SANDUSDT LONGOur token of interest is ready for a big move
We would start buying from the 0.6266 price level with a stop at 0.1180 level our targets spans through the range of 15RR


SAND Update (Very Bullish)From the place we entered on the chart "start" our big B wave has started.
This wave B has been a diametric, but now it seems that the final wave of this diametric (wave G) has been dwarfed.
By maintaining the green zone, it can enter the C wave of the big bullish degree.
Closing a weekly candle below the invalidation level will violate the analysis
For risk management, please don't forget stop loss and capital management
Comment if you have any questions
Thank You

SAND/USDT upward momentum from key support? 👀 🚀 SAND 💎 Paradisers,dive into the #SANDUSDT wave, catching bullish vibes from its current stronghold.
💎 After a slight stumble at $60.16, #SAND is flirting with a transformative level at $55.83, morphing past resistance into current support.Holding steady here could catapult it into a bullish odyssey, aiming to leapfrog past barriers and into uncharted territories.
💎 The crypto cosmos is a realm of rapid shifts and twists. Facing headwinds at this critical juncture could mean it's time to pivot. On standby for a rebound from the pivotal $51.387 line, yet a slip below could spell a descent into the bearish abyss.
💎 Gear up, Paradisers! The #SAND saga is unfolding, and we're here for the rollercoaster ride. Fasten your seatbelts, keep your strategies flexible, and eyes wide open for the next thrilling chapter!

NEAR/USDTNEAR can happen in two ways, because the previous increasing wave was 3 waves, probably the third wave of 3 or 5 waves can happen. The targets of this growth are also specified in the chart.
