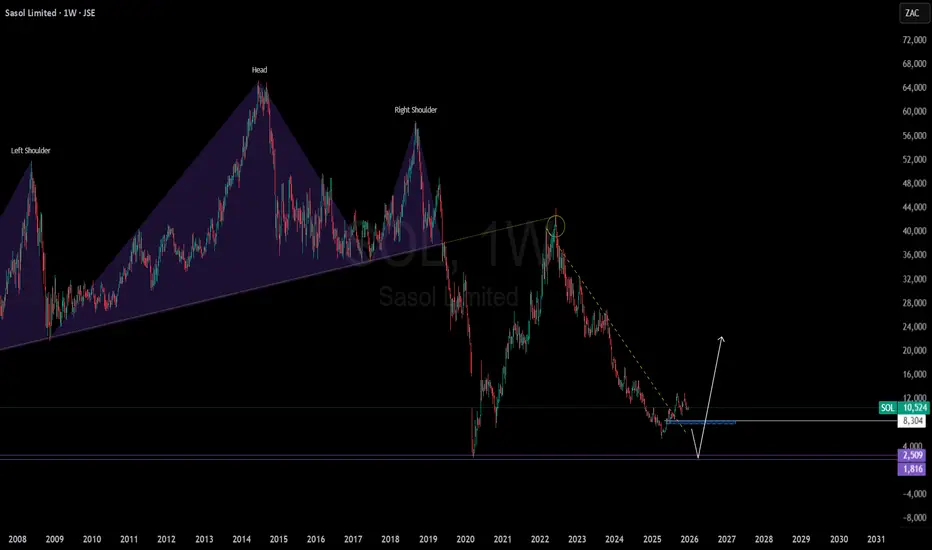
SASOL to revisit Covid lows of 2020 as Oil prices pullbackFrom our November 2023 analysis, medium-long term sentiments were strongly bearish towards R71. Price did behave as expected and went as far as printing a low around R53.01 in May 2025 before going on to print what seems to be developing into a Head and Shoulders price pattern between September and
Sasol Ltd.
No trades
Next report date
—
Report period
—
EPS estimate
—
Revenue estimate
—
0.58 USD
378.95 M USD
13.95 B USD
560.42 M
About Sasol Limited
Sector
Industry
CEO
Simon Baloyi
Website
Headquarters
Sandton
Founded
1950
Identifiers
2
ISINZAE000006896
Sasol Ltd. is a chemical and energy company, which engages in the business of sourcing, producing, and marketing chemical and energy products. It operates through the Southern Africa Energy and Chemicals, and International Chemicals segments. The Southern Africa Energy and Chemicals segment covers mining, gas, and fuels segments. The International Chemicals segment refers to the chemical products operations located in Africa, America, and Eurasia. The company was founded on September 26, 1950 and is headquartered in Sandton, South Africa.
Related stocks
Time to buy some Sasol againIt looks like Sasol is holding support pretty well. Time to buy again we think
SOL Long Term Long PositionJSE:SOL credit rating has been stamped with a Ba1 by Moody's which is very unfavourable to the company, wholistically. This is as a result of its weakening operating performance mainly attributed to low demand in the chemicals market and weak oil prices.
With expectations of higher FX:USOIL pric
SASOL: Potential Recovery After Breaking 2002 Low ZoneSASOL has broken below its 2002 low zone and returned back into it. The unconventional price action and recent bullish momentum suggest possible recovery movements. Keep watch on price behavior around this historical support level.

$JSESOL - Sasol: 5301 cps The Key Level To WatchTrade summary:
The major correction from 43860 cps has seen the share price decline by 87.91%.
The decline traced out a zigzag pattern and has potentially bottomed at 5301 cps, which is the key invalidation level.
The bounce from 5301 can be labelled as a five-wave advance when looked at in the dai

SOL (Sasol) short term bounce playSasol gapped down on major oil pullback. Looking for a short term bounce of this trendline support level with also potential to close price gap.

SSL | Long (Speculative Value Play) | Deep Value l | (June 25)SSL | Direction: Long (Speculative Value Play) | Key Reason: Deep Value & Bounce Potential | (June 25, 2025)
1️⃣ Insight Summary
SSL (Sasol Limited) is deeply undervalued compared to peers, trading around $4.55 against annual revenue near $14.7 B—presenting a potential rebound opportunity if it sta

Sasol (SOL) UpwardsTECHNICAL ANALYSIS
1. SOL bounced from a supply/support zone that was created @ end Oct 2020 R71 to R75(marked in yellow.
2. Multiple short & long term BUY opportunity offered as long as price remains above R70
3. Short term = < 12 months
4. Long term is above 12 to 24 months
TRADE IDEA
1. Buy with

Sasol limited Sasol in long run will come back it won't break the order u can purchase sasol shares at R110

Our opinion on the current state of SASOL(SOL)Sasol (SOL) is a large international chemicals and energy company with roots in the oil-from-coal technology developed during apartheid-era South Africa. Approximately 50% of the company’s profits are tied directly to the oil price. Sasol’s two main growth areas are its 50% stake in the ethane crack

See all ideas
Summarizing what the indicators are suggesting.
Neutral
SellBuy
Strong sellStrong buy
Strong sellSellNeutralBuyStrong buy
Neutral
SellBuy
Strong sellStrong buy
Strong sellSellNeutralBuyStrong buy
Neutral
SellBuy
Strong sellStrong buy
Strong sellSellNeutralBuyStrong buy
An aggregate view of professional's ratings.
Neutral
SellBuy
Strong sellStrong buy
Strong sellSellNeutralBuyStrong buy
Neutral
SellBuy
Strong sellStrong buy
Strong sellSellNeutralBuyStrong buy
Neutral
SellBuy
Strong sellStrong buy
Strong sellSellNeutralBuyStrong buy
Displays a symbol's price movements over previous years to identify recurring trends.
SSL5148309
Sasol Financing USA LLC 5.5% 18-MAR-2031Yield to maturity
9.15%
Maturity date
Mar 18, 2031
SSFA5579062
Sasol Financing USA LLC 8.75% 03-MAY-2029Yield to maturity
8.00%
Maturity date
May 3, 2029
SSL4703112
Sasol Financing USA LLC 6.5% 27-SEP-2028Yield to maturity
7.29%
Maturity date
Sep 27, 2028
SSL5148308
Sasol Financing USA LLC 4.375% 18-SEP-2026Yield to maturity
4.98%
Maturity date
Sep 18, 2026
XS254624837
Sasol Financing USA LLC 4.5% 08-NOV-2027Yield to maturity
—
Maturity date
Nov 8, 2027
See all SASOF bonds
Curated watchlists where SASOF is featured.

Frequently Asked Questions
The current price of SASOF is 6.10 USD — it has decreased by −11.59% in the past 24 hours. Watch Sasol Ltd. stock price performance more closely on the chart.
Depending on the exchange, the stock ticker may vary. For instance, on OTC exchange Sasol Ltd. stocks are traded under the ticker SASOF.
We've gathered analysts' opinions on Sasol Ltd. future price: according to them, SASOF price has a max estimate of 26.73 USD and a min estimate of 6.36 USD. Watch SASOF chart and read a more detailed Sasol Ltd. stock forecast: see what analysts think of Sasol Ltd. and suggest that you do with its stocks.
SASOF reached its all-time high on May 22, 2008 with the price of 66.90 USD, and its all-time low was 1.24 USD and was reached on Mar 23, 2020. View more price dynamics on SASOF chart.
See other stocks reaching their highest and lowest prices.
See other stocks reaching their highest and lowest prices.
SASOF stock is 13.11% volatile and has beta coefficient of 0.91. Track Sasol Ltd. stock price on the chart and check out the list of the most volatile stocks — is Sasol Ltd. there?
Today Sasol Ltd. has the market capitalization of 4.09 B, it has decreased by −3.52% over the last week.
Yes, you can track Sasol Ltd. financials in yearly and quarterly reports right on TradingView.
Sasol Ltd. is going to release the next earnings report on Mar 2, 2026. Keep track of upcoming events with our Earnings Calendar.
SASOF earnings for the last half-year are 1.39 USD per share, whereas the estimation was 1.13 USD, resulting in a 22.59% surprise. The estimated earnings for the next half-year are 0.64 USD per share. See more details about Sasol Ltd. earnings.
Sasol Ltd. revenue for the last half-year amounts to 7.11 B USD, despite the estimated figure of 7.03 B USD. In the next half-year revenue is expected to reach 7.42 B USD.
SASOF net income for the last half-year is 121.35 M USD, while the previous report showed 241.96 M USD of net income which accounts for −49.85% change. Track more Sasol Ltd. financial stats to get the full picture.
As of Jan 2, 2026, the company has 27.41 K employees. See our rating of the largest employees — is Sasol Ltd. on this list?
EBITDA measures a company's operating performance, its growth signifies an improvement in the efficiency of a company. Sasol Ltd. EBITDA is 3.33 B USD, and current EBITDA margin is 22.96%. See more stats in Sasol Ltd. financial statements.
Like other stocks, SASOF shares are traded on stock exchanges, e.g. Nasdaq, Nyse, Euronext, and the easiest way to buy them is through an online stock broker. To do this, you need to open an account and follow a broker's procedures, then start trading. You can trade Sasol Ltd. stock right from TradingView charts — choose your broker and connect to your account.
Investing in stocks requires a comprehensive research: you should carefully study all the available data, e.g. company's financials, related news, and its technical analysis. So Sasol Ltd. technincal analysis shows the neutral today, and its 1 week rating is neutral. Since market conditions are prone to changes, it's worth looking a bit further into the future — according to the 1 month rating Sasol Ltd. stock shows the sell signal. See more of Sasol Ltd. technicals for a more comprehensive analysis.
If you're still not sure, try looking for inspiration in our curated watchlists.
If you're still not sure, try looking for inspiration in our curated watchlists.