$SOL Sasol. Double bottomHad Sasol bottomed out ?
Double bottom followed by higher highs and lower lows.
Maybe worth a punt.
Next report date
—
Report period
—
EPS estimate
—
Revenue estimate
—
6ZAR
8.80 BZAR
289.70 BZAR
579.17 M
About SASOL LIMITED
Sector
CEO
Simon Baloyi
Headquarters
Sandton
Website
Employees (FY)
29.07 K
Founded
1950
ISIN
ZAE000006896
FIGI
BBG000BTZ0H6
Sasol Ltd. operates as a chemical and energy company, which engages in the business of sourcing, producing, and marketing chemical and energy products. It operates through the Energy and Chemical businesses. The Energy business covers mining, gas, and fuels segments. The Chemicals business refers to the chemical products operations located in Africa, America, and Eurasia. The company was founded on September 26, 1950, and is headquartered in Johannesburg, South Africa.

$JSESOL - Sasol: I Count Five Waves Down; 11036 cps Key LevelSee link below for previous analysis.
Fives waves can be counted from 32381 to 11036 cps for wave of the zigzag.
The bounce from 11036 has not yet unfolded in five waves to give me strong conviction but it was preceded by MACD/price bullish convergence; I am neutral to bullish at this early stage

The trend is a-changing?Interesting perspective here on Sasol.
We use a weekly chart and show how that downward sloping trendline has changed from resistance to support.
Could this finally be the changing the tide?

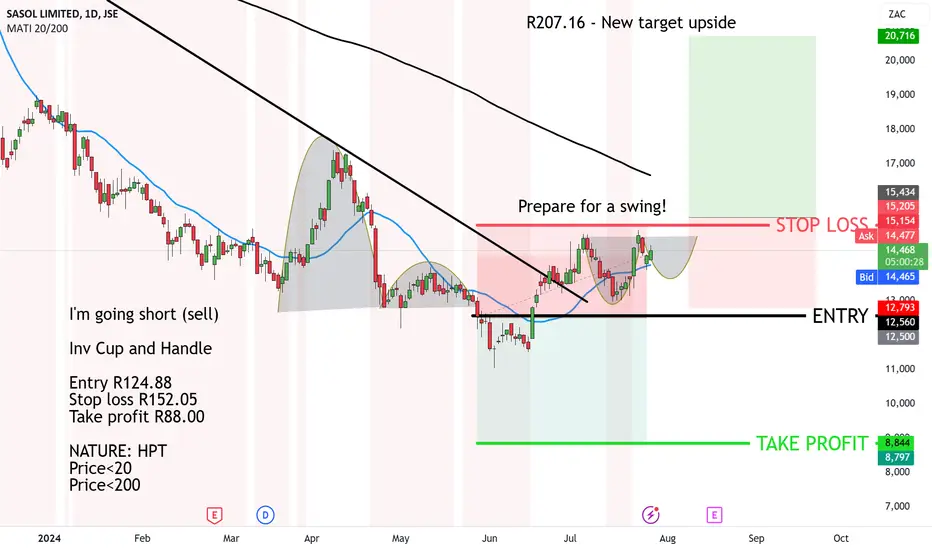
Sasol short about to get stopped out - Ready for a swing longTrades don't always work out.
The trick is to prepare for not only the stop loss to be hit but also the counter action immediately afterwards at times.
So in this case, the false break below lead to a rounding bottom and following another higher rounding bottom
If it breaks above, we will be s
Will SASOL's market price make a Market Structure Shift?Support and Resistance Levels:
All-Time Low: At 2,110c
Highlighted Support Zones:
Around 12,000c — 13,000c (Green shaded zone) — This has been tested multiple times, indicating a strong support level.
Around 10,900c(Recent support zone marked as LL) — Recently established support zone.
High

Sasol EnergyReason for execution
1)PML & PWL LIQUIDATED
2)+BOS & ChoCH
3)0.236 Fibonacci Retracement
4) positive OF
5)1.618 Fib Expansion
SOL: second move unfolding?A price action above 13700 supports a bullish trend direction.
Further bullish confirmation for a break above 13700.
The target price is set at 15100.
The stop-loss price is set at 12700.
Remains a risky trade.

$JSESOL - Sasol: 13226 Gives Way, What Now?See link below for previous analysis.
Sasol did not take long to confirm that the down move was not complete.
The bounce from 13226 to 17380 is for wave (iv); the current sell-off is for wave (v) of .
The earliest indication that wave (v) is done will be a break above 17380.
It's a bit late to b

Our opinion on the current state of SASOL(SOL)Sasol, a prominent international chemicals and energy company based in South Africa, has its origins in the oil-from-coal technology developed during the apartheid era. The company is significantly influenced by fluctuations in the oil market, with about 50% of its profits directly linked to oil pri

SOL.JSE Sasol Trend Cloud & Fibonacci Study.Sasol has shown a decent recovery from the last selloff.
Also winning the recent Emissions court case seems to have Boosted the Stock Price.
The Chart is self Explanatory.
As always, please get a few outside Expert's Advice before taking Trade or Investment Decisions.
Should you appreciate my Cha

See all ideas
An aggregate view of professional's ratings.
Curated watchlists where SOL is featured.

Frequently Asked Questions
The current price of SOL is 14,180 ZAC — it has decreased by 1.00% in the past 24 hours. Watch SASOL LIMITED stock price performance more closely on the chart.
Depending on the exchange, the stock ticker may vary. For instance, on JSE exchange SASOL LIMITED stocks are traded under the ticker SOL.
SOL stock has risen by 3.51% compared to the previous week, the month change is a 2.75% rise, over the last year SASOL LIMITED has showed a 40.42% decrease.
We've gathered analysts' opinions on SASOL LIMITED future price: according to them, SOL price has a max estimate of 55,000.00 ZAC and a min estimate of 14,200.00 ZAC. Watch SOL chart and read a more detailed SASOL LIMITED stock forecast: see what analysts think of SASOL LIMITED and suggest that you do with its stocks.
SOL stock is 3.33% volatile and has beta coefficient of 1.02. Track SASOL LIMITED stock price on the chart and check out the list of the most volatile stocks — is SASOL LIMITED there?
Today SASOL LIMITED has the market capitalization of 91.38 B, it has increased by 10.98% over the last week.
Yes, you can track SASOL LIMITED financials in yearly and quarterly reports right on TradingView.
SASOL LIMITED is going to release the next earnings report on Aug 19, 2024. Keep track of upcoming events with our Earnings Calendar.
SOL earnings for the last half-year are 20.37 ZAC per share, whereas the estimation was 22.92 ZAC, resulting in a −11.13% surprise. The estimated earnings for the next half-year are 18.27 ZAC per share. See more details about SASOL LIMITED earnings.
SASOL LIMITED revenue for the last half-year amounts to 136.28 B ZAC, despite the estimated figure of 135.19 B ZAC. In the next half-year revenue is expected to reach 138.01 B ZAC.
SOL net income for the last half-year is 9.58 B ZAR, while the previous report showed −5.78 B ZAR of net income which accounts for 265.87% change. Track more SASOL LIMITED financial stats to get the full picture.
SASOL LIMITED dividend yield was 7.29% in 2023, and payout ratio reached 121.41%. The year before the numbers were 3.96% and 23.58% correspondingly. See high-dividend stocks and find more opportunities for your portfolio.
As of Jul 27, 2024, the company has 29.07 K employees. See our rating of the largest employees — is SASOL LIMITED on this list?
EBITDA measures a company's operating performance, its growth signifies an improvement in the efficiency of a company. SASOL LIMITED EBITDA is 71.67 B ZAR, and current EBITDA margin is 25.72%. See more stats in SASOL LIMITED financial statements.
Like other stocks, SOL shares are traded on stock exchanges, e.g. Nasdaq, Nyse, Euronext, and the easiest way to buy them is through an online stock broker. To do this, you need to open an account and follow a broker's procedures, then start trading. You can trade SASOL LIMITED stock right from TradingView charts — choose your broker and connect to your account.
Investing in stocks requires a comprehensive research: you should carefully study all the available data, e.g. company's financials, related news, and its technical analysis. So SASOL LIMITED technincal analysis shows the buy rating today, and its 1 week rating is neutral. Since market conditions are prone to changes, it's worth looking a bit further into the future — according to the 1 month rating SASOL LIMITED stock shows the sell signal. See more of SASOL LIMITED technicals for a more comprehensive analysis.
If you're still not sure, try looking for inspiration in our curated watchlists.
If you're still not sure, try looking for inspiration in our curated watchlists.