SCUSDT.P trade ideas

SiaCoin - Down Down DownAnalysis:
- Fibonacci Retracement
- Support & Resistance
- Trendline Analysis
- Order Block Flow
Target 1: $0.017
Target 2: $0.014
Target 3: $0.008
Opinion:
SiaCoin has entered a corrective cycle
I have laid out potential targets
I believe when SiaCoin crosses the Green Line that will end the correction
I will do a follow up bullish markup when this idea concludes


SC (SIA COIN) - As you askedSia Coin has 2 potential Target areas but first it needs to cross the 0.04 resistance.
Don't FOMO, wait for the breakout confirmation.
I've put the support and TP areas on the chart.
⚠️ NOTE: This usually happens when a coin gets hot on crypto platforms: it might go down by a little and then get back up to a new high.
Good Luck 🎲
Tell me your ideas. Like and Share 🗣✅

Siacoin Crypto The Next King Of Storage SectorThe 4-hour technical chart of SC crypto projects a positive trend. According to pivot points, Siacoin’s critical support level is $0.03462. Whereas if it moves upside, the crucial resistance to watch is $0.04439. Besides, the chart also features a bearish pin bar candle showing a bearish trend with low reliability.
The Exponential Moving Average (EMA), consisting of EMA 20 & 50, acts as solid support in the coin’s price. EMA 20 is moving beneath the EMA-50 line, indicating bearish momentum. Investors may perceive the price is also trying to get above EMA-20. So until the price remains below both EMA, it will ensure Siacoin’s bearish momentum.
The CCI (Bearish) with the value of -33 indicates a sell signal in the coin, and the line went down from 24 to -33 on intraday session considered to be in an oversold region. It may plunge in short-term trading sessions.
The volume of (2.26M) showcases below the Volume MA (2.82M) of 20-days. The investors in Siacoin are maintaining the order book to sustain their price at current levels. Investors may also observe declining volume in the chart, indicating a big move is expected soon.
The parabolic SAR indicator suggests a buy signal in SC on intraday. No signs of a sell signal have been seen, which is an excellent sign for Siacoin’s investors.


Siacoin to the ATH Siacoin is on fire 🔥🔥🔥
I think that the short term target is 0.09-0.10
After the ATH the targets will be,
14 cent
20 cent
The coin will move with XRP so keep an eye on it

Siacoins pays off the patientSiacoin is a tough HODL as we see the whole market including ''oldschool'' coins pumping like mad with insane gains.
But this is how SC has been acting this run, big long painful consolidations and then ROCKETS!
At this TF we can see that Sia might be forming a I H&S this means nothing really cause its a low TF and not perfect but im almost certain (unless BTC decides to dip) that we will retest the fib level we have been trying to break.
The consolidation at this level is pretty strong. Next resistance after the one we will cross soon is the 618 of the big dip from April, so that will possibly prove to be a hard resistance at around 0.05$, but we will have to see, i think its possible once SIA takes off the fomo will be strong as it has been with the whole market.
Lets hope our Hodling pays off soon and we can dump our nice bags. Mt TP will be at .05 and then around .075 (could reach .08 or .09 but imo not 10 cents yet)

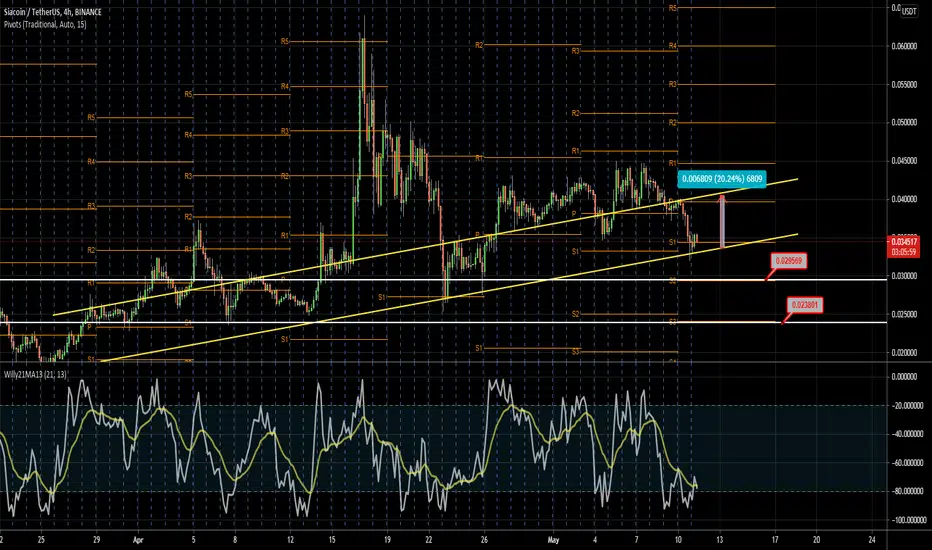
The bullish channel of SIA coin !!!Hello everyone ! I have published an idea about SIA before but the trend line did not hold .Here I am with very strong trend lines and ideas. In the chart MACD says both up and down trends are getting weaker and volumes are also decreasing which shows the consolidation. The good news is, we would come to end of it. BTC is very important as well. If if drops, alts are following it. Resistance levels on the chart with fibonacci retracements. Have a nice one !


Siacoin / TetherUS View 240Hey is today a good day? We watch a lot of interesting things.
There is a good upside move that you should look forward to in the market for the SC / USDT coin.
The market is about to push up too much, it is on its 50% retracement. But for the moment no sign of buying, however we are in an upward underlying trend.
The presence of bears is not confirmed as we can see on the volume and a bullish MACD with an Rsi in the underbought zone. So it is not to be ruled out to see a strong bulls comeback.
The uptrend line can be tested for further confirmation of this trigger. And come on price returns previously negotiated.
Please like and follow, thank you.


SC Going to Pump ...Siacoin going to break the strong resistance and pump more than 30% ... our midterm target is $0.10


LETS DO THIS SIACOIN!!!!!SiaCoin moves perfectly in the accumulation zones. After the breakout, I expect a breakout to the height of the two accumulation tunnels.

SIA- On supportIs the storm over or will cryptos dip lower?
Nobody knows but the chart is always the answer.
SIA Coin on support.

Is Sia Coin going up? Hello traders, as you can see there is a good trend that siacoin follows for now. There is a cup and handle formation and ascending triangle on the cart. If BTC hold 58 300 levels it seems like siacoins turn is coming as well. In the fibonacci levels resistance is around 0.495 and cup and handle target is 0.55 . If it goes to 0.40 levels and spend time there for 4 hours, you can stop and targets are not valid. Have a nice trades

SCUSDT: Keep breaking new highsHello traders!
It looks like SC somehow managed to create a loop that keeps breaking new highs. The current formation is also the same as previous ones which means a new high is coming soon.
I started all the trendlines from 29 Jan which is the base of all trendlines. Every new high is the breakout of the base High + previous high's trendline. After making new high Market moves own in a correction form which can be seen very clearly. Once it breaks the correction it runs to Make a new high. In the current scenario, correction is already broken and it is heading towards a new high.
Don't forget to hit the like button and follow to stay connected.
