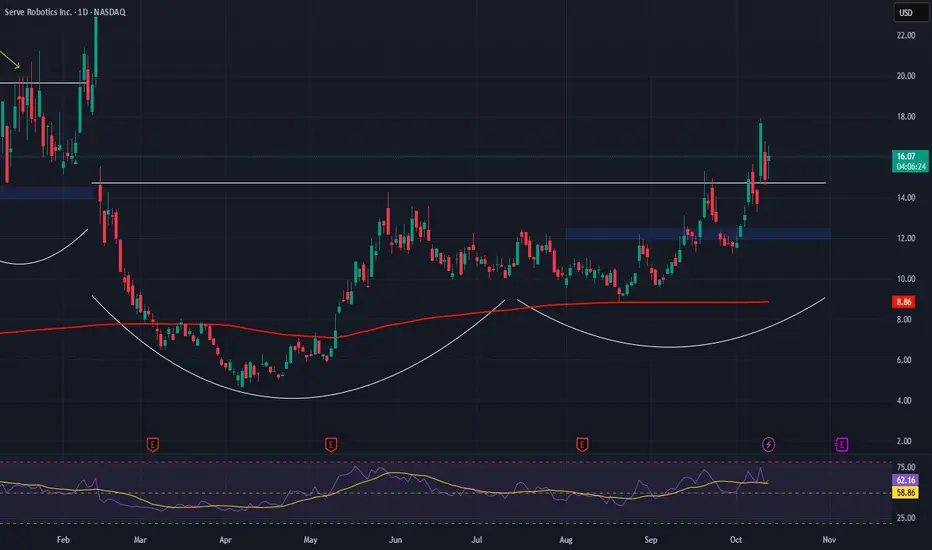
$SERV: trend structure analysis I like the monthly consolidation structure from a macro-bullish perspective. However, on the short-term, I cannot rule out that the complex consolidation has not yet fully resolved. Price may have already formed a lower high and entered the early stages of a new downside wave toward macro support, o
Serve Robotics Inc.
No trades
Next report date
—
Report period
—
EPS estimate
—
Revenue estimate
—
−1.49 USD
−39.19 M USD
1.81 M USD
64.94 M
About Serve Robotics Inc.
Sector
Industry
CEO
Ali Kashani
Website
Headquarters
Redwood City
Founded
2017
IPO date
Apr 18, 2024
Identifiers
3
ISIN US81758H1068
Serve Robotics, Inc. engages in providing self-driving delivery. It designs, develops, and operates zero-emissions robots that serve people in public spaces, starting with food delivery. The company was founded by Ali Kashani, Dmitry Demeshchuk and MJ Burk Chun in 2017 and is headquartered in Redwood City, CA.
Related stocks

SERV: Long term viewSERV
.
- Long term view.
Just on the reacumulation range, and the future is ahead.
.
US STOCKS- WALL STREET DREAM- LET'S THE MARKET SPEAK!

Bullish on SERVI really really like this set up for SERV. I feel there is a lot of positive momentum in robotics for 2026. SERV was a favorite pick on MSNBC and there is simply lots of positive energy and hype around this sector, in particular service robotics, which is the first leg of our journey into humanoid w

Serv pivot longServ I have followed for a while and the stock appears to be basing here. This is also exactly where the golden fib is, my favorite trading strategy. I note a meaningful rise in volume and BBWP is strengthening with lots of room to run. My plan would be a swing to 14.17.

$SERV - Growth Potential Amid Financial Headwinds and TechnicalNASDAQ:SERV is a high-growth, early-stage robotics company focused on autonomous delivery. While it shows strong revenue growth and low debt, it is currently unprofitable with very high negative margins and significant cash burn.
Technically, the stock is in a bullish trend; however, recent volat

Why Did The Market Bounce Today? Today the market bounced for 2 reasons....
1. Broadcom NASDAQ:AVGO received news of another OPENAI partnership. This multi year billion dollar deal caused the stock to bounce double digits. When this name rallies it causes liquidity to flow into the $SOXX. Semiconductors are still the heartbeat o

Serve Robotics Inc. (NASDAQ: SERV) – Bullish Setup EmergingServe Robotics NASDAQ:SERV is revolutionizing last-mile logistics with AI-powered delivery robots, offering strong exposure to the booming robotics and automation sector. The company's recent momentum and strategic partnerships signal major upside potential.
🔍 Key Drivers:
📈 Explosive Growth:
Q
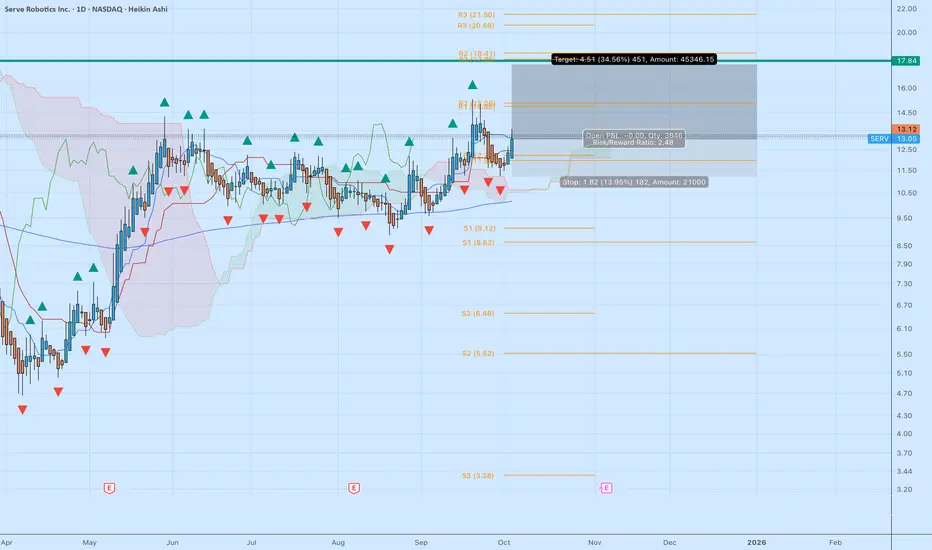
SERVE Robotics (NASDAQ: SERV) – Ichimoku-Based Trade SetupSERVE Robotics (NASDAQ: SERV) – Ichimoku-Based Trade Setup
Ticker: SERV
Exchange: NASDAQ
Chart: 1D Heikin Ashi with Ichimoku Cloud, Pivot Points, and Risk/Reward setup
Trade Idea: Long position targeting 17.84 (+34.5%) with stop at 11.23 (–13.9%)
Risk/Reward Ratio: 2.48
Technical Analysis (
SERV ( Serve Robotics Inc ) - Stock ... looking JUICY !!!Talked about this on todays Live Stream
Broke out of side ways accumulation
VERY nice retrace then broke resistance level
to come back to retest and break out of zone
- Would like to see a 9% - 10% pull back
before the upside continuation
Instructions on chart
NFA - Not Financial Advice
Join

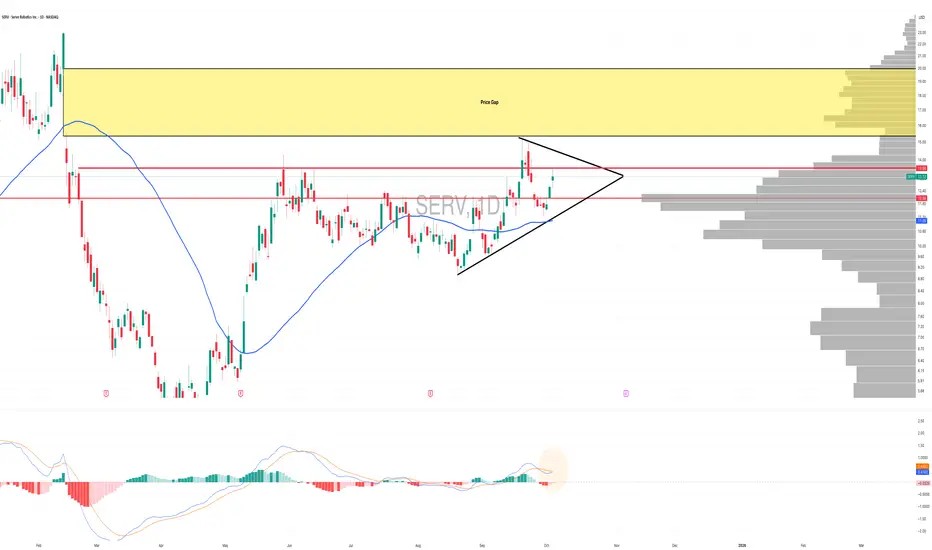
$SERV Weekend Analysis - October 5th, 2025NASDAQ:SERV is setting up for what could be a pretty solid 25–35% move if the pattern plays out. We’ve got a clean ascending triangle forming, with price currently testing resistance around $13.56. For the next leg up, I’d want to see that level flipped into support.
If we get continuation and pri
See all ideas
Summarizing what the indicators are suggesting.
Neutral
SellBuy
Strong sellStrong buy
Strong sellSellNeutralBuyStrong buy
Neutral
SellBuy
Strong sellStrong buy
Strong sellSellNeutralBuyStrong buy
Neutral
SellBuy
Strong sellStrong buy
Strong sellSellNeutralBuyStrong buy
An aggregate view of professional's ratings.
Neutral
SellBuy
Strong sellStrong buy
Strong sellSellNeutralBuyStrong buy
Neutral
SellBuy
Strong sellStrong buy
Strong sellSellNeutralBuyStrong buy
Neutral
SellBuy
Strong sellStrong buy
Strong sellSellNeutralBuyStrong buy
Displays a symbol's price movements over previous years to identify recurring trends.
Frequently Asked Questions
The current price of SERV is 10.43 USD — it has decreased by −7.70% in the past 24 hours. Watch Serve Robotics Inc. stock price performance more closely on the chart.
Depending on the exchange, the stock ticker may vary. For instance, on NASDAQ exchange Serve Robotics Inc. stocks are traded under the ticker SERV.
SERV stock has fallen by −20.95% compared to the previous week, the month change is a 1.76% rise, over the last year Serve Robotics Inc. has showed a −36.79% decrease.
We've gathered analysts' opinions on Serve Robotics Inc. future price: according to them, SERV price has a max estimate of 26.00 USD and a min estimate of 15.00 USD. Watch SERV chart and read a more detailed Serve Robotics Inc. stock forecast: see what analysts think of Serve Robotics Inc. and suggest that you do with its stocks.
SERV reached its all-time high on Jan 6, 2025 with the price of 24.35 USD, and its all-time low was 1.77 USD and was reached on May 23, 2024. View more price dynamics on SERV chart.
See other stocks reaching their highest and lowest prices.
See other stocks reaching their highest and lowest prices.
SERV stock is 9.06% volatile and has beta coefficient of 2.94. Track Serve Robotics Inc. stock price on the chart and check out the list of the most volatile stocks — is Serve Robotics Inc. there?
Today Serve Robotics Inc. has the market capitalization of 776.86 M, it has decreased by −3.51% over the last week.
Yes, you can track Serve Robotics Inc. financials in yearly and quarterly reports right on TradingView.
Serve Robotics Inc. is going to release the next earnings report on Mar 5, 2026. Keep track of upcoming events with our Earnings Calendar.
SERV earnings for the last quarter are −0.40 USD per share, whereas the estimation was −0.32 USD resulting in a −26.70% surprise. The estimated earnings for the next quarter are −0.48 USD per share. See more details about Serve Robotics Inc. earnings.
Serve Robotics Inc. revenue for the last quarter amounts to 687.00 K USD, despite the estimated figure of 695.46 K USD. In the next quarter, revenue is expected to reach 767.58 K USD.
SERV net income for the last quarter is −33.02 M USD, while the quarter before that showed −20.85 M USD of net income which accounts for −58.37% change. Track more Serve Robotics Inc. financial stats to get the full picture.
No, SERV doesn't pay any dividends to its shareholders. But don't worry, we've prepared a list of high-dividend stocks for you.
As of Feb 2, 2026, the company has 121 employees. See our rating of the largest employees — is Serve Robotics Inc. on this list?
EBITDA measures a company's operating performance, its growth signifies an improvement in the efficiency of a company. Serve Robotics Inc. EBITDA is −82.46 M USD, and current EBITDA margin is −2.10 K%. See more stats in Serve Robotics Inc. financial statements.
Like other stocks, SERV shares are traded on stock exchanges, e.g. Nasdaq, Nyse, Euronext, and the easiest way to buy them is through an online stock broker. To do this, you need to open an account and follow a broker's procedures, then start trading. You can trade Serve Robotics Inc. stock right from TradingView charts — choose your broker and connect to your account.
Investing in stocks requires a comprehensive research: you should carefully study all the available data, e.g. company's financials, related news, and its technical analysis. So Serve Robotics Inc. technincal analysis shows the strong sell today, and its 1 week rating is strong sell. Since market conditions are prone to changes, it's worth looking a bit further into the future — according to the 1 month rating Serve Robotics Inc. stock shows the neutral signal. See more of Serve Robotics Inc. technicals for a more comprehensive analysis.
If you're still not sure, try looking for inspiration in our curated watchlists.
If you're still not sure, try looking for inspiration in our curated watchlists.