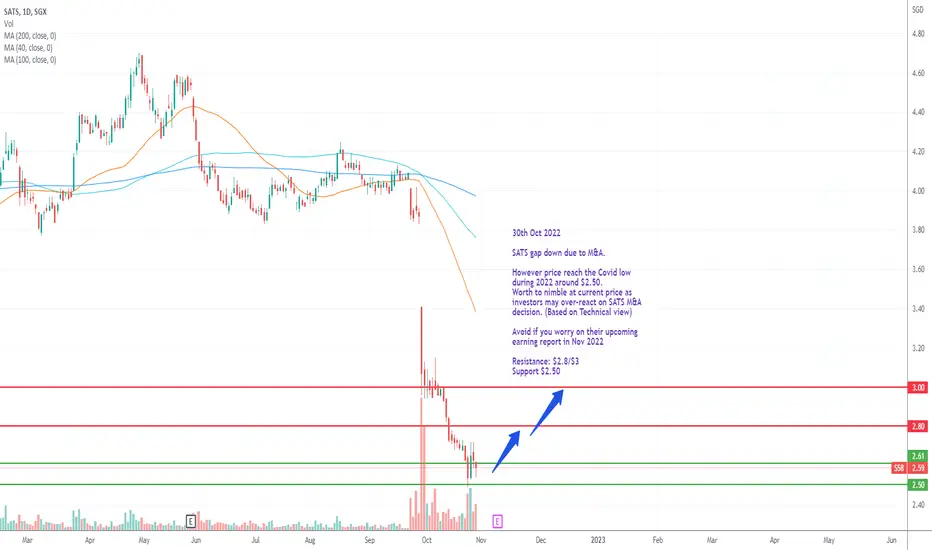
SATS Bias more on upside from chart perspective30th Oct 2022
SATS gap down due to M&A.
However price reach the Covid low during 2022 around $2.50.
Worth to nimble at current price as investors may over-react on SATS M&A decision. (Based on Technical view)
Avoid if you worry on their upcoming earning report in Nov 2022
Resistance: $2.8/$3
Sup
Next report date
Report period
H2 2023
EPS estimate
—
Revenue estimate
—
−0.00SGD
−26.51 MSGD
1.76 BSGD
887.04 M
About SATS
Sector
Industry
CEO
Tee Heong Mok
Website
Headquarters
Singapore
Founded
1972
ISIN
SG1I52882764
FIGI
BBG000C8FR39
SATS Ltd. is an investment holding company, which engages in the provision of food solutions and gateway services. It operates through the following segments: Food Solutions, Gateway Services, and Others. The Food Solutions segment provides in-flight and institutional catering, food processing, distribution services, and airline laundry services. The Gateway Services segment offers both airport and cruise terminal services. The Others segment comprises of rental of premises and other services. The company was founded on December 15, 1972 and is headquartered in Singapore.
Bias more on upside. 27th March 2022
SATS part of the business is to provide flight catering. Since country open up, all related to Travel Sector will be benefited from it.
Once it break above the flag channel resistance, we may see next resistance at $4.60 and may hit jackpot at $5.16 (78.6% Fibo) to complete the

[Analysis] SATS... is recovery on its way?From a long-term perspective, the low during Apr 2020 covid19 marks a higher low and creates major support at 2.50-3.00 level. Since then, prices have rebounded more than 60% and eventually hitting the resistance of 4.60.
The price is now retracing lower and forming (seems like) a bullish flag on a

<TradeVSA> SATS Pullback Successfully with green pentagonSign of Strength in the chart:
1. Strong uptrend with GAP
2. Reaccumulation
3. Triple NS signal
4. Green Pentagon, increasing volume at resistance
Hit the "LIKE" button to support us :)
Disclaimer
This information only serves as reference information and does not constitute a buy or sell call. Co

SATS $4.55 then $5.85SATS S58 : TARGETS $4.55 (quantstrategic.com.sg)
Refer to my previous post, $4.55 has been hit intraday.
Short term trend is UP
Medium trend is UP since 091120
Long term trend down pending break of $4.55
PIVOT $4.15
Long positions above $4.15 target 4.55 and 5.85
Short positions below $4.15 target

S58.SGX_LongENTRY: 4.12
TP: 4.46
SL: 3.89
- ADX<25. Would like to be higher.
- RSI>60.
- FFI and RS +ve
- MAs are aligned. 10MA below 40MA but pointing up.
- Looks like demand is there.
- Once above HVN 4.14, it should have more upside.

SATS S58 : TARGETS $4.55SATS is bullish with a buy signal on 020221 on the 4hr at $3.95 and the dailies on 080221 at $4.05. The medium term trend is up since 091120 last year with buyers pushing price above $3.40 to test $4.55, the pivot point on the longer term monthly charts.
Short Term Trend UP since 020221
Medium Tren

SATS Ready to Explode Higher!False break below 100 & 200 Month MA and now waiting for announcement of COVID Relief bill to explode for Santa Claus Rally!
Lots of profits from COVID vaccine storage


See all ideas
Trade directly on the supercharts through our supported, fully-verified and user-reviewed brokers.


Frequently Asked Questions
The current price of S58 is 2.53 SGD — it has increased by 0.80% in the past 24 hours.
Depending on the exchange, the stock ticker may vary. For instance, on SGX exchange SATS stocks are traded under the ticker S58.
SATS is going to release the next earnings report on May 27, 2024. Keep track of upcoming events with our Earnings Calendar.
S58 stock is 1.60% volatile and has beta coefficient of 1.29. Check out the list of the most volatile stocks — is SATS there?
S58 earnings for the last quarter are 0.05 SGD per share, whereas the estimation was 0.05 SGD resulting in a −5.87% surprise. The estimated earnings for the next quarter are 0.03 SGD per share. See more details about SATS earnings.
SATS revenue for the last quarter amounts to 545.60 M SGD despite the estimated figure of 490.00 M SGD. In the next quarter revenue is expected to reach 353.67 M SGD.
Yes, you can track SATS financials in yearly and quarterly reports right on TradingView.
S58 stock has risen by 3.27% compared to the previous week, the month change is a 0.39% fall, over the last year SATS has showed a 3.07% decrease.
S58 net income for the last quarter is −7.80 M SGD, while the quarter before that showed 6.00 M SGD of net income which accounts for −230.00% change. Track more SATS financial stats to get the full picture.
Today SATS has the market capitalization of 3.74 B, it has decreased by 1.21% over the last week.
Like other stocks, S58 shares are traded on stock exchanges, e.g. Nasdaq, Nyse, Euronext, and the easiest way to buy them is through an online stock broker. To do this, you need to open an account and follow a broker's procedures, then start trading. You can trade SATS stock right from TradingView charts — choose your broker and connect to your account.
Investing in stocks requires a comprehensive research: you should carefully study all the available data, e.g. company's financials, related news, and its technical analysis. So SATS technincal analysis shows the buy rating today, and its 1 week rating is sell. Since market conditions are prone to changes, it's worth looking a bit further into the future — according to the 1 month rating SATS stock shows the sell signal. See more of SATS technicals for a more comprehensive analysis.
If you're still not sure, try looking for inspiration in our curated watchlists.
If you're still not sure, try looking for inspiration in our curated watchlists.
We've gathered analysts' opinions on SATS future price: according to them, S58 price has a max estimate of 3.50 SGD and a min estimate of 2.31 SGD. Read a more detailed SATS forecast: see what analysts think of SATS and suggest that you do with its stocks.
EBITDA measures a company's operating performance, its growth signifies an improvement in the efficiency of a company. SATS EBITDA is 438.50 M SGD, and current EBITDA margin is 4.29%. See more stats in SATS financial statements.