SHIB -40%I don't think this meme coin does anything special anymore. All meme coins are showing decline. +All other coins too.
It's very easy with meme coins, they go where they came from.
Maybe 15% will increase, but this is also doubtful
This could be wrong
SHIBUST.P trade ideas

SHIBUSDT IDEAHello Traders Hope You Are Enjoying Our Analysis. Today We Will Discuss About SHIB
(Update)
Trying To Breakout The Triangle To The Upside On Daily Chart☑️
Currently Sitting In Its Support Zone Suggesting a Potential Bounce From This Level⚡️

SHIBUSDT 1D#SHIB is currently sitting in its support zone, suggesting a potential bounce from this level. If it loses this support, the next level to watch is $0.00001830, which aligns with the daily MA200. Should a breakout occur, the target levels are:
$0.00002757
$0.00003184
$0.00003712
$0.00004567

SHIB: buy📊Analysis by AhmadArz:
🔍Entry: 1875
🛑Stop Loss: 1728
🎯Take Profit: 2009 - 2137 - 2334
🔗"Uncover new opportunities in the world of cryptocurrencies with AhmadArz.
💡Join us on TradingView and expand your investment knowledge with our five years of experience in financial markets."
🚀Please boost and💬 comment to share your thoughts with us!

Long trade
Friday 3rd May 24
19.00pm
Tokyo Session
Entry 0.00002483
Profit level 0.00002819 (13.53%)
Stop level0.00002346 (5.25%)

SHIB ANALYSIS🔮 #SHIB Analysis 💰💰
🌟🚀 As we can see that there is a breakdown of descending triangle in #SHIB. There is a support level at $0.00001902, it will first retest its support level then after that we would see a reversal from support level . 🚀🚀
#SHIB #Cryptocurrency #DYOR

$SHI / USDT bullish wave coming soon. Be ready!CRYPTOCAP:SHIB is in a bullish pennant flag that is about to break out to the upside. It is a beautiful flag with a huge pole, perfectly executed.
The Fibonacci retracement is giving us the target price (TP) with 100% potential.
Just follow the chart; it is pretty obvious. The Stochastic RSI is about to pump on the daily chart.
Everything is aligned for a bullish wave.
DYOR (Do Your Own Research), as anything can happen. This is my personal opinion, not investment advice.

it's the time to start the BULLRUN for SHIBA INUBINANCE:SHIBUSDT finished the wave 4 of Elliott 5 waves & now we are at the start of wave 5 & targets on the chart.
Let's start the BULLRUN for SHIBA INU

SHIBUSDT.1DIn this technical analysis of the SHIB/USDT daily chart, we explore the recent price movements and use key technical indicators to forecast potential future trends.
Key Observations:
Current Price and Recent Movement:
SHIB/USDT is trading at a price of $0.00001854, showing a moderate increase of 2.49% today. This suggests a possible change in market sentiment or response to external stimuli.
Support and Resistance Levels:
R1 (Resistance Level 1): $0.00001825 - It's noteworthy that the current price has surpassed this level, indicating a potential new support if the price sustains or advances further.
R2 (Resistance Level 2): Marked on the chart but not numerically identified, this would be the next target for bullish momentum.
S1 (Support Level 1): Marked around a previous low (exact value not visible), serving as the primary support area to watch if a reversal occurs.
Technical Indicators:
MACD (Moving Average Convergence Divergence): Currently below the zero line but the histogram suggests decreasing negative momentum, indicating a possible bullish reversal in the making.
RSI (Relative Strength Index): At 31.26, it's nearing the oversold territory, which might attract buying interest as traders perceive it as undervalued.
Analysis and Conclusion:
The current trading pattern in SHIB/USDT reflects a slight bullish recovery, indicated by the price crossing above R1. If the market sustains this rally, R2 could be the next logical target. The improving MACD, moving from deeper negative territories towards the baseline, supports this bullish outlook as it often precedes a change in trend.
However, the RSI near the oversold boundary suggests that while immediate selling pressure might be subsiding, caution is still warranted. A retest of the new support level at R1 (previously R1 resistance) could confirm its reliability for maintaining the upward momentum.

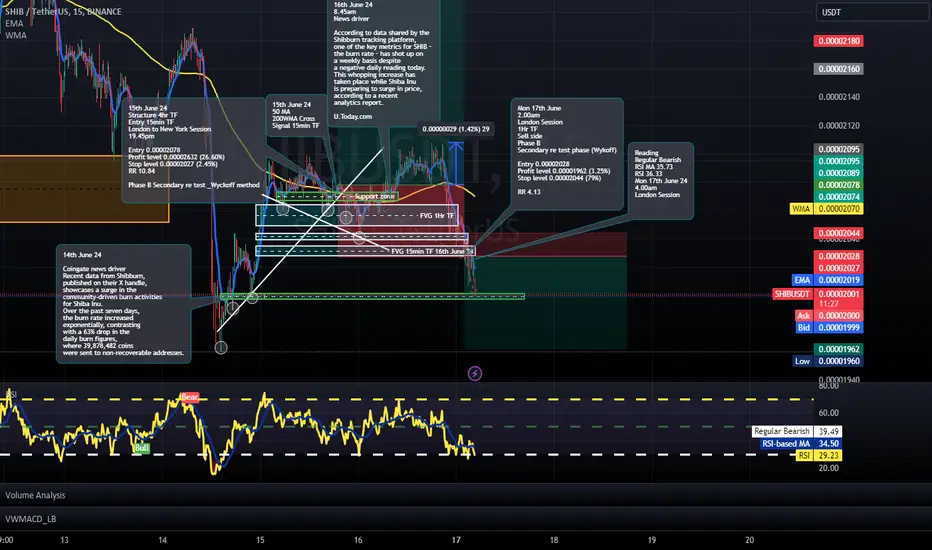
Short trade Mon 17th June
2.00am
London Session
1Hr TF
Sell side
Phase B
Secondary re test phase (Wykoff)
Entry 0.00002028
Profit level 0.00001962 (3.25%)
Stop level 0.00002044 (79%)
RR 4.13
selling opportunity for the SHIB/USDT pair at the current price selling opportunity for the SHIB/USDT pair at the current price of 0.00002248. It's recommended to consider initiating a sell order at this level.
Furthermore, it's advised to set take-profit targets at 0.00002163 and 0.00001950 to secure potential gains in the event of price declines.
To mitigate risk, it's prudent to establish a stop-loss order at 0.00002400 to limit potential losses if the market moves unfavorably.
Remember to trade according to your risk tolerance and strategy, and stay vigilant of market developments for informed decision-making."

Shib usdt will drop This is my trading program on Shib, and I expect the price of altcoins to fall even up to 50% in the coming days, and after that, the attractive growth of crypto.

Shibusdtlet's go just buy and do not afraid,
StopLoss => a bearish candle closed in Daily TF below the BPR box

SHIB Daily LongIt seems that CRYPTOCAP:SHIB can correct up to the specified range. The market has taken a corrective downward trend in recent days and there is no good reason for the market to become bullish. What it seems is that this time and price break is necessary for the market to continue its upward trend.

Shiba is currently well-positioned for growthIn the daily chart of Shiba, positive divergence is visible across multiple indicators. This suggests that Shiba is in an excellent position to experience significant growth from this area. Positive divergence occurs when the price makes lower lows, but indicators like RSI and MACD make higher lows, signaling weakening bearish momentum and a potential upward reversal.
Shiba is currently well-positioned for growth. If Bitcoin and the broader market conditions remain stable, Shiba could see considerable growth from this range.

SHIBUSDT Sell Signal AlertDear Traders,
Based on the latest analysis, we have identified a potential SELL opportunity for the SHIBUSDT currency pair. This forecast is made using the EASY Quantum Ai strategy, which leverages advanced algorithms and historical data for precise market predictions.
Direction: Sell
Enter Price: 2.291E-05
Take Profit: 2.253E-05
Stop Loss: 2.346E-05
Reasoning:
1. Overbought Conditions: SHIBUSDT appears to be in an overbought condition, as suggested by our momentum indicators. This often signals a potential downward correction.
2. Resistance Level: The enter price of 2.291E-05 aligns with a significant resistance level that SHIBUSDT has struggled to break in recent trading sessions.
3. Volume Analysis: Recent volume trends indicate a decrease in buying pressure, supporting the possibility of a sell-off.
This alert is generated to help you make informed decisions and maximize profit potential while managing risks effectively. As always, ensure to adjust your trading strategy to reflect your personal risk tolerance and investment goals.
Happy Trading,
EASY Quantum Ai Team

Rolley -ShibaDear traders, Hello.
I hope you have a good day.
I think it is the best time to buy Shiba in the range of 20-21. and TPs are 28, 31 and 36

SHIB priceFor the past few trading sessions, it remained in the closed range and faced rejection from its 50 day EMA mark.

Long trade
Pair: SHIBUSDT
15th June 24
Structure 4hr TF
Entry 15min TF
London to New York Session
19.45pm
Entry 0.00002078
Profit level 0.00002632 (26.60%)
Stop level 0.00002027 (2.45%)
RR 10.84
Mapping entry..?
Phase B Secondary re test _Wyckoff method

SHIBUSDT Trading Signal: BuyDear Traders,
We have identified a trading opportunity for the currency pair SHIBUSDT. Below are the specifics for executing this trade:
Direction: Buy
Enter Price: 2.077E-05
Take Profit: 2.118E-05
Stop Loss: 2.017E-05
Rationale:
This signal is generated using the EASY Quantum Ai strategy, which utilizes advanced algorithms to analyze market trends and price movements. Here are the key factors influencing this signal:
1. Market Momentum: Our data analysis indicates an upward momentum in SHIBUSDT, driven by recent positive sentiment and increased trading volume.
2. Historical Support Levels: The enter price of 2.077E-05 aligns with a historical support level, which suggests a good entry point for a potential upward movement.
3. Resistance Projections: The take profit level at 2.118E-05 has been identified as a short-term resistance point. Breaking this level could signal a continuation of the bullish trend.
4. Risk Management: The stop loss at 2.017E-05 is strategically placed to minimize potential losses, ensuring a controlled risk environment.
We advise monitoring the trade closely and adjusting as market conditions evolve. Ensure you have your risk management strategies in place when executing the trade.
Stay informed and trade wisely!
Sincerely,
Your Trading Strategy Team

SHIBUSDT Trading Signal: Buy AlertDear Traders,
We have identified a promising opportunity in the SHIBUSDT currency pair using our proprietary EASY Quantum Ai strategy. Below are the specifics of the trade signal:
Direction: Buy
Enter Price: 2.369E-05
Take Profit: 2.564E-05
Stop Loss: 2.16E-05
Rationale for the Signal: Our EASY Quantum Ai strategy has flagged this buy opportunity based on several key market indicators:
1. Market Momentum: Recent analysis shows a surge in buying interest in SHIBUSDT. Momentum indicators suggest a strong upward trend is forming, making it an ideal time to enter a long position.
2. Support and Resistance Levels: The current market price has found solid support around the 2.369E-05 level, reducing downside risk. Furthermore, our projections indicate that the price has room to move upward toward our take profit target of 2.564E-05.
3. Volume Trends: Observations indicate increasing trading volumes, which typically precede substantial price movements. High volumes can signify strong investor confidence and potential for price acceleration.
4. Quantitative Analysis: Our quantum-based models predict a high probability of SHIBUSDT reaching our TP levels while maintaining a manageable risk with our predefined SL.
By following this signal, you can capitalize on the current market dynamics and potentially achieve significant gains. Please ensure you set your orders as per the specified entry, take profit, and stop loss levels.
Stay tuned for more updates and trade responsibly.
Best regards,
Your Trading Team
SHIBUSDT Trading Signal: BuyDirection: Buy
Enter Price: 2.349E-05
Take Profit: 2.379E-05
Stop Loss: 2.307E-05
We have identified a promising buying opportunity for the SHIBUSDT pair.
Why Buy?
The SHIBUSDT pair is currently showing strong bullish signals, according to our EASY Quantum Ai strategy. Our analysis considers multiple factors, including:
1. Trend Analysis: The recent trend for SHIBUSDT has shown consistent upward movement, indicating a strong buying momentum.
2. Volume Analysis: There has been a significant increase in trading volume, which often precedes price movements.
3. Technical Indicators: Key technical indicators such as RSI and MACD are supporting the bullish trend, with RSI not yet in the overbought zone, suggesting there is still room for growth.
Risk Management:
Always ensure proper risk management by adhering to the recommended Take Profit and Stop Loss levels. This approach minimizes potential losses while maximizing potential gains.
Stay tuned for more updates, and trade wisely!
Note: This signal is generated using the EASY Quantum Ai strategy.

bulls take control after 800 days of pain 🔥boost and follow for more 🚀 in the last few weeks shiba has finally broken its bearish downtrend, its time for the bulls to take the wheel... sorry bears 😉
maybe a bit of sideways/consolidation before the next move, but looking for a rally .000054-.000067-.000088 in the medium/short term. 🎯🔥
