NEM trade ideas

NEM share prices extended its run to the upside up 3.30%NEM - Newmont Goldcorp share prices extended its run to the upside after breaking out of a critical support price level at 40.00 and hit 40.75 from time of reporting up 3.30%. Share prices currently float around 40.90, a vital resistance price point which it needs to break through to continue to its next target at approximately 41.60.
It is wise for traders/Investors to park some money in Gold stocks to hedge their position in times of financial market crisis. The current support levels are estimated at 40.10, 39.60, 38.95, 38.00, and 37.20

Newmont Gold stays green on a horrific day.On a horrendous day in the markets NEM managed to stay in the green yesterday, such strength can't be ignored as there was a rush for anythings linked to gold. They only issue is that the market is so unpredictable that if you're not in it now, a change in market sentiment could really hurt the miners.
It going long stop losses need to be tight or possible wait for the $40 mark to break, which has held as strong resistance for 2 years.
AVERAGE ANALYSTS PRICE TARGET $43
AVERAGE ANALYSTS RECOMMENDATION OVERWEIGHT
P/E RATIO
SHORT INTEREST 3%
COMPANY PROFILE
Newmont Goldcorp Corp. is a gold producer, which engages in the production of gold. It operates through the following geographical segments: North America, South America, Australia, and Africa. The North America segment consists primarily of carlin, phoenix, twin creeks and long canyon in the state of Nevada and Cripple Creek and Victor in the state of Colorado, in the United States. The South America segment consists primarily of Yanacocha in Peru and Merian in Suriname. The Australia segment consists primarily of Boddington, Tanami and Kalgoorlie in Australia. The Africa segment consists primarily of Ahafo and Akyem in Ghana. The company was founded by William Boyce Thompson on May 2, 1921 and is headquartered in Greenwood Village, CO.$


prophetic dreamsat resistance, one of the largest distributions within GDX. can she do it. with a dovish fed i say yes

Gold has been struckThis video is about XAUUSD physical gold price and some gold stocks! Physical gold looks like it will go up another 12 percent but the stocks look like A 30-40% move is on its way!


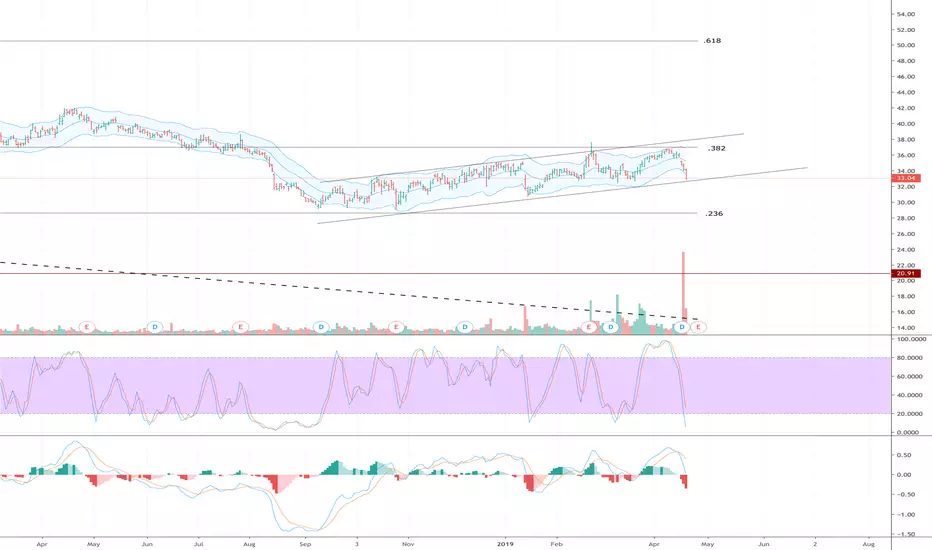
NEM Rubberband SnapbackNEM is now on its 5th-6th up day, making it overextended and overbought. It was breached the top layer of the bollinger band and is at about 98 out of 100 on the stochastics chart. These all combined lead me to believe we will see a retracement for the next several days in NEM until its moving averages catch up around the 32.85 to 33.30 mark for a short play with 3-5% profit potential.


BOTTOM FISHING : Is NEM a buy here ?NEM seems to have touched bottom area of 29.12 to 29.93 for potential BUY. This is also to earlier support from Sept 2018 / Oct 2018. Take profits at 33.17 to 34.34.
The idea used here is Volume Profile (Flexible) and Point of Control. NEM is was selected via a proprietary scanner tool separately.

Newmont Mining (NEM) BUY swing trade ( 2 to 4 months approx)Looking for a 50% return on this stock. Below 32 i will be out of this one

NEMWatching this one closely, break down from channel could be a great short, and a vice versa if channel provides further support.
Newmont Mining Longterm Monthly OutlookUltra bullish scenario. Long term hold targeting the all time high.


NEM BAMM - Long trage NEM is in the process of printing Bat pattern still incomplete but we can try to trade B->D move which is often happens. Since when I am writing this idea price already broke B point I have to frame it with two entries.
Entry 1 (preferred) - we see daily pin of high volume so there is a good chance of B point line to be re-tested. Wait until it is tested and see if it provides support to the stock price. If it does - price bounces of it on good volume and produces bullish candle e.g. pin. Then we can enter long position targeting Bat's D point.
Entry 2 - if price action next week will be strong enough to break daily pin without B point re-test we can enter long position there.
Trade Exit: Automatically exit trade at 0.886 fib - Bat's D point $40.51. Even at late entry at $37.65 we can still have 7% gain. With preferred entry we can gain about 14%.
Proper money management required.

NEM longGet on board the PM train, f**k cryptos , that's yesterdays news.
TP and SL levels are on the chart. Trade accordingly.

