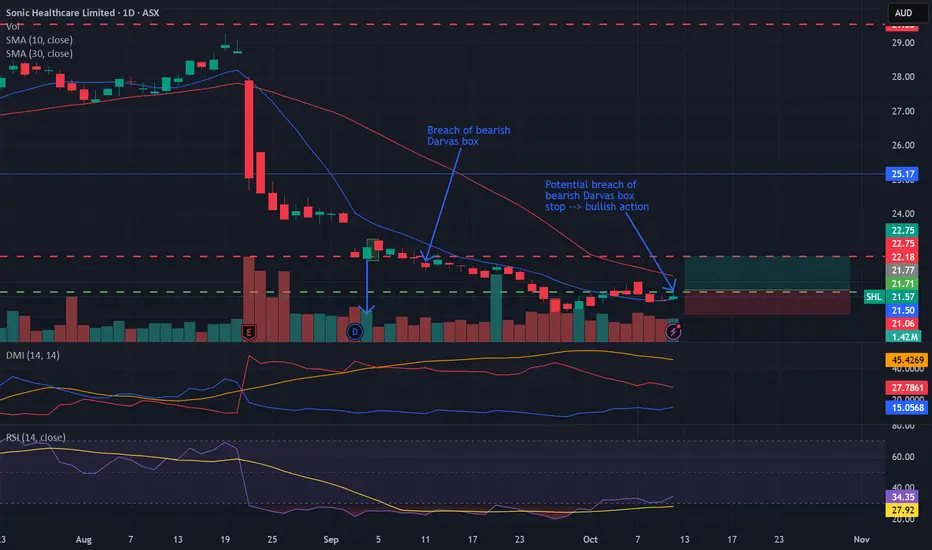
Bullish potential detected for SHLEntry conditions:
(i) higher share price for ASX:SHL along with swing up of indicators such as DMI/RSI.
Depending on risk tolerance, the stop loss for the trade would be:
(i) below the recent swing low of 8th October of $21.42, or
(ii) below the prior swing low of $21.07 from 26th September.
Sonic Healthcare Ltd.
No trades
Next report date
—
Report period
—
EPS estimate
—
Revenue estimate
—
0.70 USD
337.73 M USD
6.24 B USD
456.31 M
About Sonic Healthcare Limited
Sector
Industry
CEO
Jim Newcombe
Website
Headquarters
Sydney
Founded
1934
IPO date
Sep 25, 1934
Identifiers
2
ISIN AU000000SHL7
Sonic Healthcare Ltd. engages in the provision of medical diagnostics services. It operates through the following segments: Laboratory, Radiology, and Other. The Laboratory segment offers pathology and clinical services. The Radiology segment is involved in diagnostic imaging services in Australia. The Other segment refers to the corporate office function, medical center operations and occupation health services, and other minor operations. The company was founded on September 25, 1934, and is headquartered in Sydney, Australia.
Related stocks
Sonic healthcare*Bearish sentiment with the sharp zigzag pattern.
*Divergence appeared on the RSI and the MACD which tends to pullback the price
up to the fib level.
*Once it retest the resistance zone, we see the price going further down towards
the leg c of a zigzag.
* Nice double bottom pattern with high v

Sonic Healthcare AustraliaSSI Live Trading Series
Sun Storm Investment Trading Desk & NexGen Wealth Management Service Present's
Focus: Worldwide
By Sun Storm Investment Research & NexGen Wealth Management Service
A Profit & Solutions Strategy & Research
Trading | Investment | Stocks | ETF | Mutual Funds | Crypto | B
SHL - June displays a strong historical record - Average Gain 4%Sonic Healthcare Ltd is entering a seasonally positive period. Since 2000, the month of June has been unusually kind to SHL, delivering an average gain of 4%, with a win rate of 20 from 22 events, & a standard deviation of 4.1%.
Disclaimer: This data is not financial advice. Past performance is not

SHL @ 27 SEP 2021Text me if you have any questions/comments for me.
-----
SHL
- Previous analysis was done on 13 Sep -> suggested waiting for successful rebound to around 43.00 levels before plotting entry
- Since then, the stock did not recover to around 43 levels
- Instead, the stock closed below the mid-term s

SHL @ 13 SEP 2021SHL
- Previous analysis was done on 7 Sep -> suggested waiting for successful rebound to around 43.00 levels before plotting entry
- Recent price action has provided a slightly better setup for entry
- A successful rebound to around 42.75 levels would present an opportunity for entry
- R is less th

SHL found support and now moving higherSonic healthcare looks like a carbon copy of FPH. Found support at 30 with a morning star candle after falling out of channel. 3 very bullish candles on volume now confirming a return to the channel. Targeting 34.60 area as first taregt however POC for the channel sits at 33 which could create some

SHL - Bearish Trend ConfirmationSHL - Bearish Trend Confirmation Indications:
1. The trend has got weak on the Weekly and Monthly with Bearish Engulfing Candles
2. The price has broken the trendline which is confirmation of a bearish trend
3. The down move was a powerful and impulsive wave
I expect price to retrace on the upsid

Short on Turtle soup new high then reversal
Looks like its bullish run may need some consolidation,
anticipating due to daily candle reversal after GAP to new high failed and old high penetrated.
I may hold this fora week if follows through...
tight stop loss above recent high...this seems like a lower probability, but also low risk trade.


See all ideas
Summarizing what the indicators are suggesting.
Neutral
SellBuy
Strong sellStrong buy
Strong sellSellNeutralBuyStrong buy
Neutral
SellBuy
Strong sellStrong buy
Strong sellSellNeutralBuyStrong buy
Neutral
SellBuy
Strong sellStrong buy
Strong sellSellNeutralBuyStrong buy
An aggregate view of professional's ratings.
Neutral
SellBuy
Strong sellStrong buy
Strong sellSellNeutralBuyStrong buy
Neutral
SellBuy
Strong sellStrong buy
Strong sellSellNeutralBuyStrong buy
Neutral
SellBuy
Strong sellStrong buy
Strong sellSellNeutralBuyStrong buy
Displays a symbol's price movements over previous years to identify recurring trends.
Frequently Asked Questions
The current price of SKHCF is 15.00 USD — it has decreased by −6.83% in the past 24 hours. Watch Sonic Healthcare Ltd. stock price performance more closely on the chart.
Depending on the exchange, the stock ticker may vary. For instance, on OTC exchange Sonic Healthcare Ltd. stocks are traded under the ticker SKHCF.
SKHCF stock has fallen by −6.83% compared to the previous week, the month change is a −2.60% fall, over the last year Sonic Healthcare Ltd. has showed a −11.24% decrease.
We've gathered analysts' opinions on Sonic Healthcare Ltd. future price: according to them, SKHCF price has a max estimate of 21.05 USD and a min estimate of 14.89 USD. Watch SKHCF chart and read a more detailed Sonic Healthcare Ltd. stock forecast: see what analysts think of Sonic Healthcare Ltd. and suggest that you do with its stocks.
SKHCF reached its all-time high on Jan 3, 2022 with the price of 34.42 USD, and its all-time low was 6.25 USD and was reached on Mar 9, 2009. View more price dynamics on SKHCF chart.
See other stocks reaching their highest and lowest prices.
See other stocks reaching their highest and lowest prices.
SKHCF stock is 7.33% volatile and has beta coefficient of 0.50. Track Sonic Healthcare Ltd. stock price on the chart and check out the list of the most volatile stocks — is Sonic Healthcare Ltd. there?
Today Sonic Healthcare Ltd. has the market capitalization of 7.57 B, it has decreased by −2.55% over the last week.
Yes, you can track Sonic Healthcare Ltd. financials in yearly and quarterly reports right on TradingView.
Sonic Healthcare Ltd. is going to release the next earnings report on Feb 19, 2026. Keep track of upcoming events with our Earnings Calendar.
SKHCF earnings for the last half-year are 0.38 USD per share, whereas the estimation was 0.39 USD, resulting in a −3.23% surprise. The estimated earnings for the next half-year are 0.36 USD per share. See more details about Sonic Healthcare Ltd. earnings.
Sonic Healthcare Ltd. revenue for the last half-year amounts to 3.27 B USD, despite the estimated figure of 3.38 B USD. In the next half-year revenue is expected to reach 3.51 B USD.
SKHCF net income for the last half-year is 182.09 M USD, while the previous report showed 146.43 M USD of net income which accounts for 24.36% change. Track more Sonic Healthcare Ltd. financial stats to get the full picture.
Sonic Healthcare Ltd. dividend yield was 3.99% in 2025, and payout ratio reached 100.05%. The year before the numbers were 4.03% and 98.74% correspondingly. See high-dividend stocks and find more opportunities for your portfolio.
As of Feb 14, 2026, the company has 43 K employees. See our rating of the largest employees — is Sonic Healthcare Ltd. on this list?
EBITDA measures a company's operating performance, its growth signifies an improvement in the efficiency of a company. Sonic Healthcare Ltd. EBITDA is 1.04 B USD, and current EBITDA margin is 16.82%. See more stats in Sonic Healthcare Ltd. financial statements.
Like other stocks, SKHCF shares are traded on stock exchanges, e.g. Nasdaq, Nyse, Euronext, and the easiest way to buy them is through an online stock broker. To do this, you need to open an account and follow a broker's procedures, then start trading. You can trade Sonic Healthcare Ltd. stock right from TradingView charts — choose your broker and connect to your account.
Investing in stocks requires a comprehensive research: you should carefully study all the available data, e.g. company's financials, related news, and its technical analysis. So Sonic Healthcare Ltd. technincal analysis shows the buy rating today, and its 1 week rating is sell. Since market conditions are prone to changes, it's worth looking a bit further into the future — according to the 1 month rating Sonic Healthcare Ltd. stock shows the sell signal. See more of Sonic Healthcare Ltd. technicals for a more comprehensive analysis.
If you're still not sure, try looking for inspiration in our curated watchlists.
If you're still not sure, try looking for inspiration in our curated watchlists.