Our opinion on the current state of SANLAM(SLM)Sanlam (SLM) is one of the largest insurance and financial services groups in South Africa. It was established in 1918, demutualised in 1998, and then listed on the JSE and the Namibian Stock Exchange. It has operations in South Africa, the UK, America, Europe, India, and Australia, as well as a ran
Next report date
—
Report period
—
EPS estimate
—
Revenue estimate
—
0.60 USD
1.17 B USD
12.32 B USD
1.79 B
About Sanlam Limited
Sector
Industry
CEO
Paul Brendan Hanratty
Website
Headquarters
Bellville
Founded
1918
ISIN
ZAE000070660
FIGI
BBG000G4SR03
Sanlam Ltd. engages in the provision of financial solutions to individual and institutional clients. Its solutions include individual, group and short-term insurance, personal financial services such as estate planning, trusts, wills, personal loans, health management, savings and linked products. The company operates through five clusters: Sanlam Personal Finance, Sanlam Emerging Markets, Sanlam Investments, Santam and Corporate and Other. It also offers business fitness assessment and insurance investment management, asset management, employee benefits, risk management, and capital market activities. The company was founded on June 8, 1918 and is headquartered in Bellville, South Africa.
Related stocks

Our opinion on the current state of SANLAM(SLM)Sanlam (SLM) is one of the largest and most established insurance and financial services groups in South Africa, with a rich history dating back to 1918. The company demutualised in 1998 and is listed on both the JSE and the Namibian Stock Exchange. Sanlam has a wide range of operations spanning Sou

Our opinion on the current state of SANLAM(SLM)Sanlam (SLM) is one of the largest insurance and financial services groups in South Africa, with a rich history dating back to its establishment in 1918. The company demutualised in 1998 and subsequently listed on both the JSE and the Namibian Stock Exchange. Sanlam operates across multiple geograph
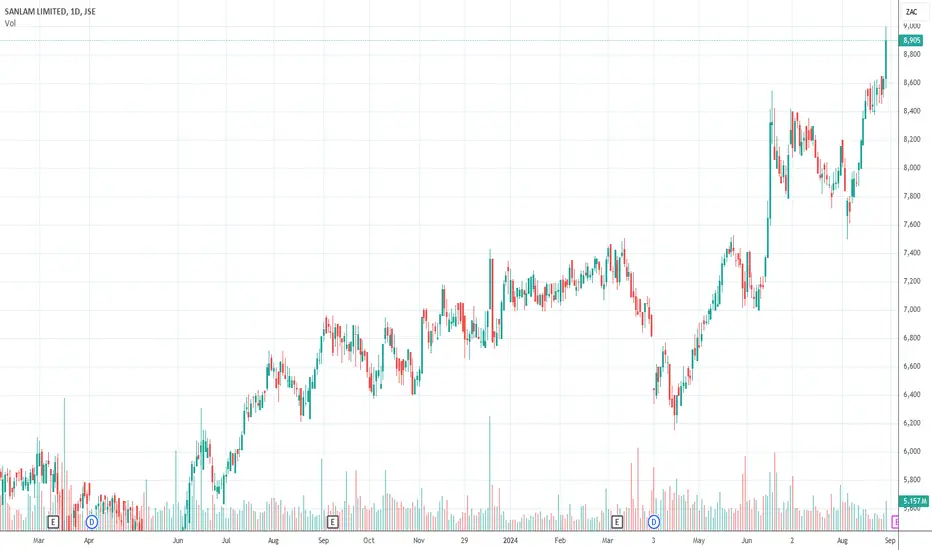
Sanlam broken above W Formation and new target setW Formation formed on Sanlam and the price has broken above the neckline.
Nature: High Probability
Price>20 and 200MA
Downtrend broken which tells us the bulls are in charge (action line)
Target R97.11

$JSESLM - Sanlam: More Upside PotentialSee link below for previous analysis.
I have made a minor adjustment to the wave count with wave 3 terminating at the March high.
The stock looks to be unfolding in a five wave impulse from 6150 cps and is currently in the third wave of wave 5 of (3).
Buy the dips.

Our opinion on the current state of SANLAM(SLM)Sanlam (SLM) is one of the largest insurance and financial services groups in South Africa. It was established in 1918 and demutualised in 1998, subsequently listing on the JSE and the Namibian Stock Exchange. The company operates in South Africa, the UK, America, Europe, India, Australia, and a ran
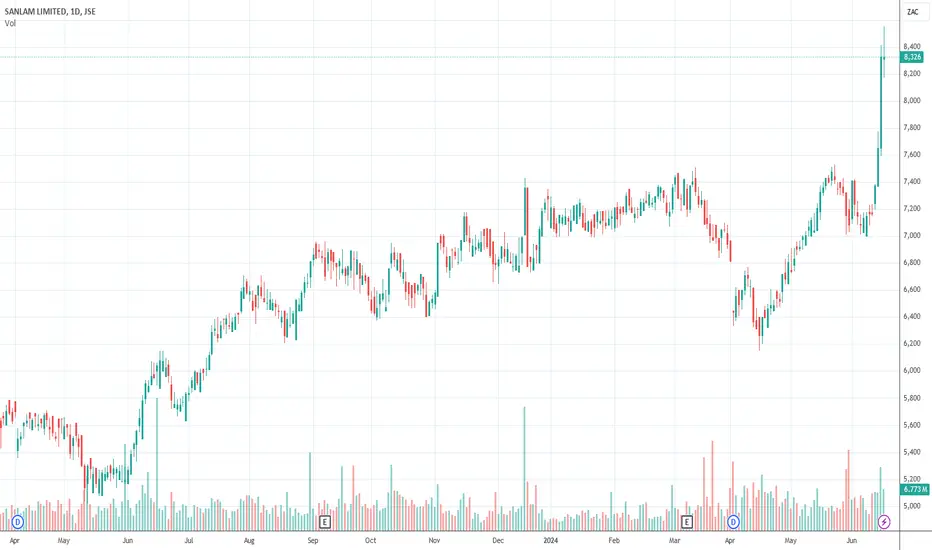
SLMTuesday 21-May-2024.This is a high risk idea thus smaller positions will apply. The share has developed a 'V-shaped' reversal, with aggressive buying in recent weeks, however, the current rating reflects excessively overbought conditions into overhead resistance. Failure to hold the prior session hi

Our opinion on the current state of SANLAM(SLM)Sanlam is a powerhouse in the insurance and financial services industry, not just in South Africa but on a global scale. Established in 1918, it has expanded its operations significantly over the years, now reaching into multiple continents including Africa, Europe, America, and Asia, with particula

SLMFriday 01-March-2024, 06h30 | Sticking with SLM Sanlam, the price action is also in line with yesterday morning’s pre-market reading via the Tactical Trading Guide which looked for a re-test of the 50-day EMA followed by a rebound. See chart + reading below:

SLMSLM Sanlam & Sanlam vs Top 40 | On an absolute basis, Sanlam is trading just below multi-year highs, however, having traded in a tight range for several weeks. This is a healthy technical development. On a relative basis, the share is trading near 52-week highs versus the broader markets (Top 40 as

See all ideas
Summarizing what the indicators are suggesting.
Neutral
SellBuy
Strong sellStrong buy
Strong sellSellNeutralBuyStrong buy
Neutral
SellBuy
Strong sellStrong buy
Strong sellSellNeutralBuyStrong buy
Neutral
SellBuy
Strong sellStrong buy
Strong sellSellNeutralBuyStrong buy
An aggregate view of professional's ratings.
Neutral
SellBuy
Strong sellStrong buy
Strong sellSellNeutralBuyStrong buy
Neutral
SellBuy
Strong sellStrong buy
Strong sellSellNeutralBuyStrong buy
Neutral
SellBuy
Strong sellStrong buy
Strong sellSellNeutralBuyStrong buy
Displays a symbol's price movements over previous years to identify recurring trends.
EEDM
iShares IV PLC - iShares MSCI EM CTB Enhanced ESG UCITS ETF Unhedged USDWeight
0.44%
Market value
36.99 M
USD
EDM2
iShares IV PLC - iShares MSCI EM CTB Enhanced ESG UCITS ETF Accum Shs Unhedged USDWeight
0.44%
Market value
36.99 M
USD
Explore more ETFs
Frequently Asked Questions
The current price of SLMAF is 3.48 USD — it has decreased by −3.12% in the past 24 hours. Watch Sanlam Ltd. stock price performance more closely on the chart.
Depending on the exchange, the stock ticker may vary. For instance, on OTC exchange Sanlam Ltd. stocks are traded under the ticker SLMAF.
We've gathered analysts' opinions on Sanlam Ltd. future price: according to them, SLMAF price has a max estimate of 6.81 USD and a min estimate of 5.59 USD. Watch SLMAF chart and read a more detailed Sanlam Ltd. stock forecast: see what analysts think of Sanlam Ltd. and suggest that you do with its stocks.
SLMAF reached its all-time high on Mar 13, 2018 with the price of 7.77 USD, and its all-time low was 0.93 USD and was reached on Jul 23, 2003. View more price dynamics on SLMAF chart.
See other stocks reaching their highest and lowest prices.
See other stocks reaching their highest and lowest prices.
SLMAF stock is 3.22% volatile and has beta coefficient of 1.35. Track Sanlam Ltd. stock price on the chart and check out the list of the most volatile stocks — is Sanlam Ltd. there?
Today Sanlam Ltd. has the market capitalization of 11.58 B, it has decreased by −2.55% over the last week.
Yes, you can track Sanlam Ltd. financials in yearly and quarterly reports right on TradingView.
Sanlam Ltd. is going to release the next earnings report on Mar 5, 2026. Keep track of upcoming events with our Earnings Calendar.
SLMAF net income for the last half-year is 572.71 M USD, while the previous report showed 647.40 M USD of net income which accounts for −11.54% change. Track more Sanlam Ltd. financial stats to get the full picture.
Yes, SLMAF dividends are paid annually. The last dividend per share was 0.23 USD. As of today, Dividend Yield (TTM)% is 4.69%. Tracking Sanlam Ltd. dividends might help you take more informed decisions.
Sanlam Ltd. dividend yield was 5.12% in 2024, and payout ratio reached 41.68%. The year before the numbers were 5.49% and 56.93% correspondingly. See high-dividend stocks and find more opportunities for your portfolio.
As of Dec 5, 2025, the company has 23.93 K employees. See our rating of the largest employees — is Sanlam Ltd. on this list?
Like other stocks, SLMAF shares are traded on stock exchanges, e.g. Nasdaq, Nyse, Euronext, and the easiest way to buy them is through an online stock broker. To do this, you need to open an account and follow a broker's procedures, then start trading. You can trade Sanlam Ltd. stock right from TradingView charts — choose your broker and connect to your account.
Investing in stocks requires a comprehensive research: you should carefully study all the available data, e.g. company's financials, related news, and its technical analysis. So Sanlam Ltd. technincal analysis shows the sell today, and its 1 week rating is sell. Since market conditions are prone to changes, it's worth looking a bit further into the future — according to the 1 month rating Sanlam Ltd. stock shows the sell signal. See more of Sanlam Ltd. technicals for a more comprehensive analysis.
If you're still not sure, try looking for inspiration in our curated watchlists.
If you're still not sure, try looking for inspiration in our curated watchlists.