SNX Major Resistance Test, Breakout or Rejection?📊 Technical Analysis — NYSE:SNX
💵 Pair: SNX/USDT
⏳ Time Frame: 3D
📍 Current Price: Around $0.2614
📐 Pattern: Descending Channel
---
📉 Pattern Overview — Descending Channel
SNX/USDT appears to be moving within a Descending Channel, formed by two downward-sloping trendlines:
🔴 Upper Trendline /
SNXUSDT: Model 1 Accumulation — The Market Is Showing Its HandSNX is currently sitting in a confirmed Model 1 accumulation schematic , and the expected order flow from this structure is relatively straightforward.
My technical objective sits around $0.44 , representing roughly a 90% spot expansion from the area I'm tracking.
This isn't about predicting eve
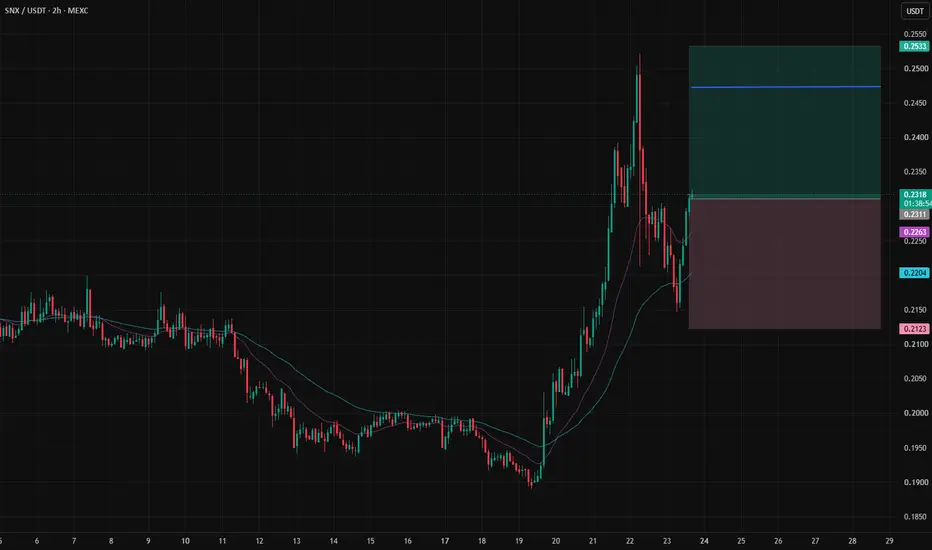
SNX/USDT H2: Upside momentum against a strong trend🎯 TP1: $0.247250 (+6.67%) │ TP2: $0.253281 (+9.27%)
🛑 SL: $0.212272 (-8.42%) │ R/R: 1 : 1.1
⚠️ SL is placed beyond recent candle wicks to reduce the risk of accidental stop-outs
FUNDAMENTAL BACKGROUND
SNX is trading without its own catalysts, following the overall improvement in crypto market senti
SNX/USDT H4: Potential reversal from the bottom🎯 TP1: $0.196057 (+1.06%) │ TP2: $0.198114 (+2.12%)
🛑 SL: $0.190260 (-1.93%) │ R/R: 1 : 1.1
⚠️ SL is placed beyond the nearest candle tails to reduce the risk of accidental triggering
FUNDAMENTAL BACKGROUND
SNX is trading without its own catalyst, following the general altcoin trend. The US Consume
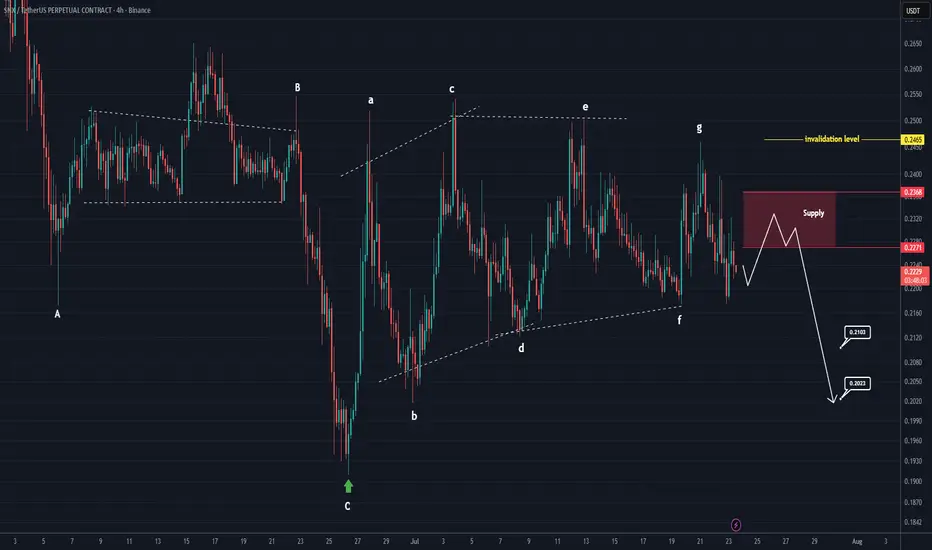
SNX will turn bearish soon (4H)SNX seems to have started from where we placed the green arrow on the chart and has formed a Diametric pattern.
This Diametric pattern has been completed, and we expect it to enter a time-consuming bearish pattern.
The best zone for sell/short positions is the highlighted red area.
The targets ar
SNX: local squeeze with $0.29 destinationThe Macro Picture 🗺️
SNX unwound from the $0.3755 May high down to $0.191 in June, then bounced and settled into a base. Price is holding at $0.2225, well above the floor, coiling in the lower half of the range as it works off the downtrend.
The Setup ⚙️
The Range Floor 🟢
$0.191 (Macro Support) i
SNXUSDT 1D#SNX is moving inside a descending channel on the daily chart and is currently testing the channel's middle trendline.
In case of a breakout above the middle line, the first upside target is:
🎯 $0.279
If #SNX then breaks above the channel resistance, the remaining upside targets are:
🎯 $0.328
🎯
SNXUSDT Forming Bullish momentumSNXUSDT is currently forming a clear bullish momentum pattern, a classic wave structure that often signals an upcoming breakout. The price has been consolidating within a narrowing range, indicating that selling pressure is gradually weakening while buyers are beginning to regain control. With consi
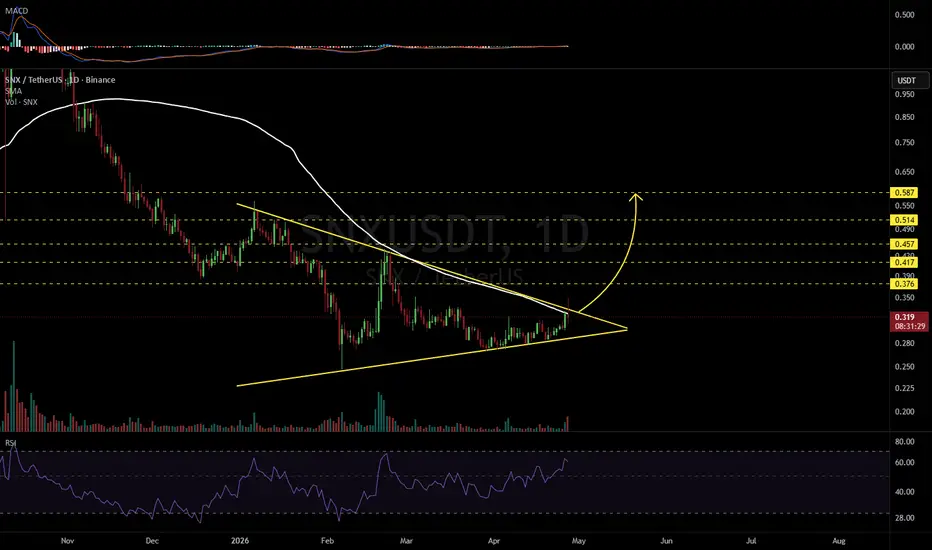
SNXUSDT 1D#SNX is moving within a symmetrical triangle on the daily chart. It is facing strong resistance from the triangle resistance and the daily SMA100. 👉 Consider entering this coin only after a solid breakout; in that case, the potential upside targets are:
🎯 $0.376
🎯 $0.417
🎯 $0.457
🎯 $0.514
🎯 $0.587
Synthetix (SNX) · How long can a bullish move last?The market is heating up. Some of these charts will not even offer enough time to post.
Watch SNXUSDT and its price today. Watch the same chart next week, watch how fast things change.
Today we have a full green candle. SNXUSDT has been sideways for months, since early Feb.
There was one attempt
See all ideas
Summarizing what the indicators are suggesting.
Oscillators
Neutral
Oscillators
Neutral
Summary
Neutral
Summary
Neutral
Summary
Neutral
Moving Averages
Neutral
Moving Averages
Neutral
Displays a symbol's price movements over previous years to identify recurring trends.