SOLUSDT – Gains Limited, Price Faces a Key Decision ZoneHello everyone, SOL experienced an impressive upward move over the past weekend, but the current momentum has noticeably weakened as the price hits the EMA 89 (blue), an area that has previously created strong selling pressure last month.
After bouncing around the 145 USD mark, SOL retraced to tes
Key stats
Related pairs

SOLUSD: Breakout from Bottom Structure Inside Downtrend ChannelHi!
SOL has been trading inside a descending channel, consistently respecting both upper and lower boundaries. Recently, price formed a clear Inverse Head & Shoulders at the bottom of the channel, signaling potential bullish reversal momentum. The neckline breakout aligns with the break of the mino

Solana Rebounds Weakly with No Clear Trend SignalsSolana on the 4H timeframe is only showing a mild pullback, as neither technicals nor news indicate fresh inflows strong enough to shift momentum. Price remains capped below the 138–142 FVG resistance cluster, and although small rebounds occur, their narrow range highlights the lack of aggressive bu

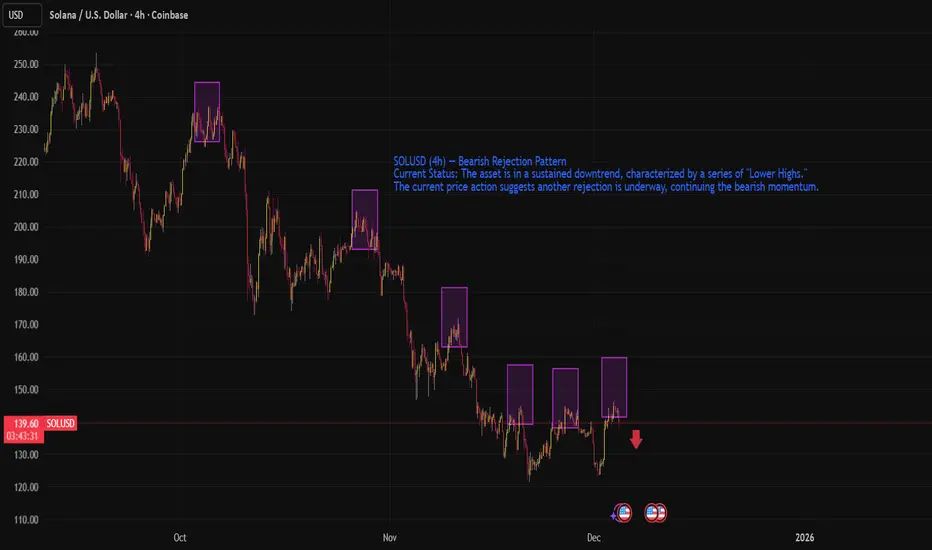
SOLUSD (4h) — Bearish Rejection PatternSOL/USD is in a sustained downtrend, characterized by a series of "Lower Highs." The current price action suggests another rejection is underway, continuing the bearish momentum.
1. Price Action: The "Lower High" Structure
The chart visually highlights (via purple boxes) a classic bearish market st
SOLUSD – Possible Reversal
SOL is currently sitting inside the 124.73–95.33 area. As long as the price stays above this area, the upside potential remains. A break and retest above 145 could signal continuation towards 180 and then 260. This idea becomes invalid if the price closes below 95.35.

SOLANA UPDATE - H2A small yet Important update for the recent analysis.
1st, we have a Strong red resistance line stretching back to the origin of this whole big bearish leg from the Top of SEP 18. This line has been respected several times & has proven to be powerful.
That same line was retested today with clear r

SOLANA Elliott Waves Analysis - 2D time frame - Christmas GiftSolana is showing strong signals of a solid downtrend.
1st, the Blue Diagonal Trend line which we cannot miss, was broken, but also Retested & so confirming the Break. These Trend lines are powerful when they are traced correctly. This line connects 6 solid bottoms since 2022 as seen on the chart,

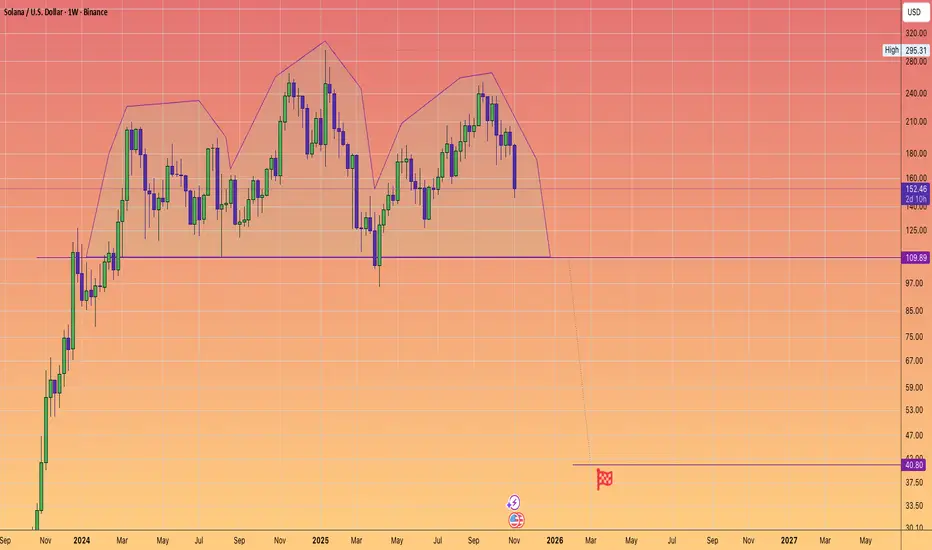
Solana could rapidly fall to $40A massive potential Head and shoulders topping exists on Solana. And many other Altcoins exhibit similar tops.
Keep nimble and protect your gains if you have them.
On the positive side, I believe the bear market will be swift and we could potentially see this number as early as next March.
Why
SOL: Major Breakout Structure Forming — Watching This Key PivotSummary
Solana has just reclaimed a key horizontal level at $144, following a clean break of the multi-week horizontal trendline. This move puts SOL back inside its prior macro structure and opens the door for continuation if the retest zone holds. It's currently retesting this for a potential SR

No Clear Path yet...but I Still Favor Higher in Orange or BlackOrange represents a FLAT retracement, whereas Black represents a standard retracement. However, since we have not even traded above the 23.6%, I am still carrying a purple OML count.
Therefore, SOL is about as clear as mud.
Chris

See all ideas
Displays a symbol's price movements over previous years to identify recurring trends.
Curated watchlists where SOLANA is featured.

Gen 3 crypto: A new day dawns…
25 No. of Symbols

Smart contracts: Make the smart decision
36 No. of Symbols

Staking Coins: Pick up a stake
18 No. of Symbols

Top altcoins: Choose your alternatives carefully
28 No. of Symbols

Up-and-coming crypto: New kids on the block
30 No. of Symbols
See all sparks
Frequently Asked Questions
SOLANA (SOL) reached its highest price on Jan 20, 2025 — it amounted to 272.99 USD. Find more insights on the SOL price chart.
See the list of crypto gainers and choose what best fits your strategy.
See the list of crypto gainers and choose what best fits your strategy.
SOLANA (SOL) reached the lowest price of 0.87 USD on Jul 21, 2020. View more SOLANA dynamics on the price chart.
See the list of crypto losers to find unexpected opportunities.
See the list of crypto losers to find unexpected opportunities.
The safest choice when buying SOL is to go to a well-known crypto exchange. Some of the popular names are Binance, Coinbase, Kraken. But you'll have to find a reliable broker and create an account first. You can trade SOL right from TradingView charts — just choose a broker and connect to your account.
You can discuss SOLANA (SOL) with other users in our public chats, Minds or in the comments to Ideas.