Falling wedges: Are you convinced now about what's to come?Yes, we are still in a downtrend, but this is not the first time this happens. Maybe this chart will convince you why.
The upcoming two weeks will become very important on what's next for COINBASE:SOLUSD : will a breakout occur on this last falling wedge just like previous times?
I think it will
Key stats
Related pairs

SOL PERPETUAL TRADE BUY SETUP Long from $144SOL PERPETUAL TRADE
BUY SETUP
Long from $144
Currently $144
Targeting $148.80 or Above
(Trading plan IF SOL
go down to $140 will add more longs)
Follow the notes for updates
In the event of an early exit,
this analysis will be updated.
Its not a Financial advice

SOLUSD SHORTTERM BUY BIASTook a BUY position and targeting this level 145.46 as my Target Level, SOLUSD is overall bearish, but we should see a consolidation just towards the 146 area, before a possible push downwards...
*TRUST THE SYSTEM*

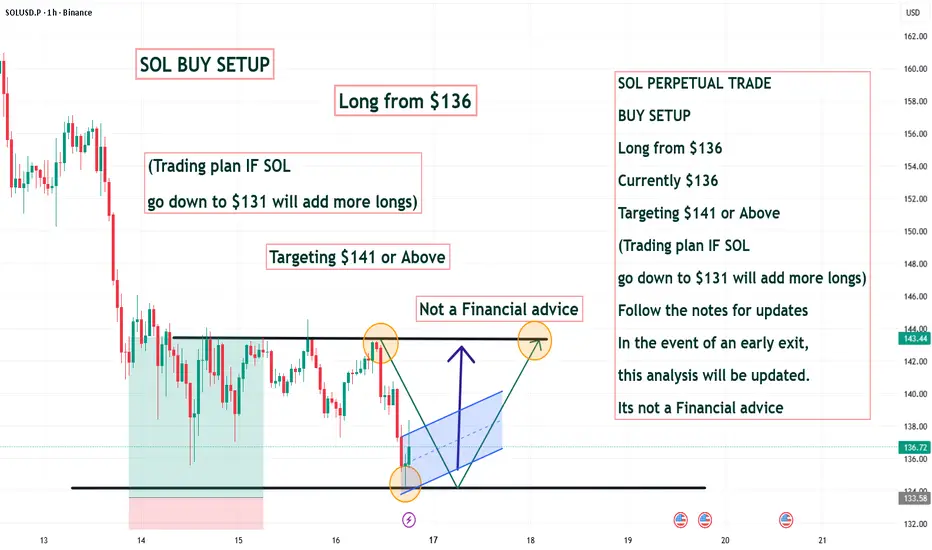
SOL PERPETUAL TRADE BUY SETUP Long from $136SOL PERPETUAL TRADE
BUY SETUP
Long from $136
Currently $136
Targeting $141 or Above
(Trading plan IF SOL
go down to $131 will add more longs)
Follow the notes for updates
In the event of an early exit,
this analysis will be updated.
Its not a Financial advice
SOLANA selling climax! #SOL | Shorting opportunity. Looks like we are about to climax this entire selling started from 18-Sept-2025.

Carbon Credit Secrets: Market Opportunity, Gobal Economic Shift1. What Carbon Credits Actually Represent (The Real Meaning)
A carbon credit is 1 metric ton of CO₂ (or equivalent greenhouse gas) reduced, captured, or avoided.
But the secret is: it’s not just a certificate—it’s a transferable promise of environmental impact.
Industries that produce high emissio

Capital Flows Impacted1. Understanding Capital Flows
Capital flows are broadly classified into two categories:
Foreign Direct Investment (FDI):
Long-term investments in physical assets like factories, infrastructure, or real estate. FDI represents stable and sustainable investment because it indicates confidence in the

SOLANA entered into bearish territory, targeting $105.Solana (SOLUSD) closed last week below its 1W MA50 (blue trend-line) for the first time since July 28 2025. This is an extension of the downtrend that started following the September 15 High, which took place right below the Resistance Zone that started back on the November 2021 Cycle Top.
This is

SOLANA TECHNICAL UPDATE (4H Chart)
After months of bullish momentum, SOL/USD just broke below the trendline — showing early signs of bearish reversal.
📉 Setup Idea:
Price broke trendline support
Now retesting the $174–182 resistance zone
If rejection confirms, next targets →
🎯 TP1: $140
🎯 TP2: $95–100
⚠️ Invalidation:
If price

SOL to $4500?Internet Capital Markets
I believe Solana is going to take over the entire financial system.

See all ideas
Displays a symbol's price movements over previous years to identify recurring trends.
Curated watchlists where SOLANA is featured.

Gen 3 crypto: A new day dawns…
25 No. of Symbols

Smart contracts: Make the smart decision
36 No. of Symbols

Staking Coins: Pick up a stake
18 No. of Symbols

Top altcoins: Choose your alternatives carefully
28 No. of Symbols

Up-and-coming crypto: New kids on the block
30 No. of Symbols
See all sparks
Frequently Asked Questions
SOLANA (SOL) reached its highest price on Jan 20, 2025 — it amounted to 272.99 USD. Find more insights on the SOL price chart.
See the list of crypto gainers and choose what best fits your strategy.
See the list of crypto gainers and choose what best fits your strategy.
SOLANA (SOL) reached the lowest price of 0.87 USD on Jul 21, 2020. View more SOLANA dynamics on the price chart.
See the list of crypto losers to find unexpected opportunities.
See the list of crypto losers to find unexpected opportunities.
The safest choice when buying SOL is to go to a well-known crypto exchange. Some of the popular names are Binance, Coinbase, Kraken. But you'll have to find a reliable broker and create an account first. You can trade SOL right from TradingView charts — just choose a broker and connect to your account.
You can discuss SOLANA (SOL) with other users in our public chats, Minds or in the comments to Ideas.