SOL Price DynamicsThe price of Solana, after attracting funds from a strong support level, started a significant upward trend. This upward movement included a retest of the support level, confirming its strength. After this retest, the price continued to rise towards higher resistance levels.
SOLUST trade ideas

Solana dead cat bounce I think Solana is due to a deep correction,
Using Elliot wave theory,
I think a regular flat is in play
Good luck

Solana TA - Small drop before continuation to the up sideSupport level around $142 - $152 which I'm expecting a bounce from, then the next stop will be around $215 - $220 followed by a small correction.
We need to head down before we continue to move forward to let the RSI cool down and allow people to take profits as Solana has moved up a lot over the last 12 months. Once we bounce of support and receive confirmation, then retail will jump in again.

Alikze »» SOL |Continuation of scenario 5 bullishAccording to the previous analysis, now with more than 110% growth since the time of the analysis, which is in the ascending wave 5, it can continue until the area of 2.618 or the next supply area of this extension of the wave, which will reach the major ceiling area, which is an important supply area. It will be and after that I expect a correction wave after which we have to do the update. But for now, a short-term trend can be imagined for it.
If the behavior and structure of the post changes, it will be updated.
»»»«««»»»«««»»»«««
Please support this idea with a LIKE and COMMENT if you find it useful and Click "Follow" on our profile if you'd like these trade ideas delivered straight to your email in the future.
Thanks for your continued support.
Sincerely.❤️
»»»«««»»»«««»»»«««

SOL [ BEARISH MOVE CONTINUATION]As of today SOL is moving extremely upward which indicates that the buyers have a tremendous control of this current move however we are basing this analysis with elliot wave were the current price action is in the correction or bearish market this move is part of the correction move of ABC currently we are looking at the chart in C action which is the final correction we're coming so beware guys ; I am also using some fvg a small part of SMC for my scalping trade , Thank you!

SOLUSDTSOLUSDT is showing trend continuation , and testing 0.5-0.618 fib retracement With trendline support , possible HL

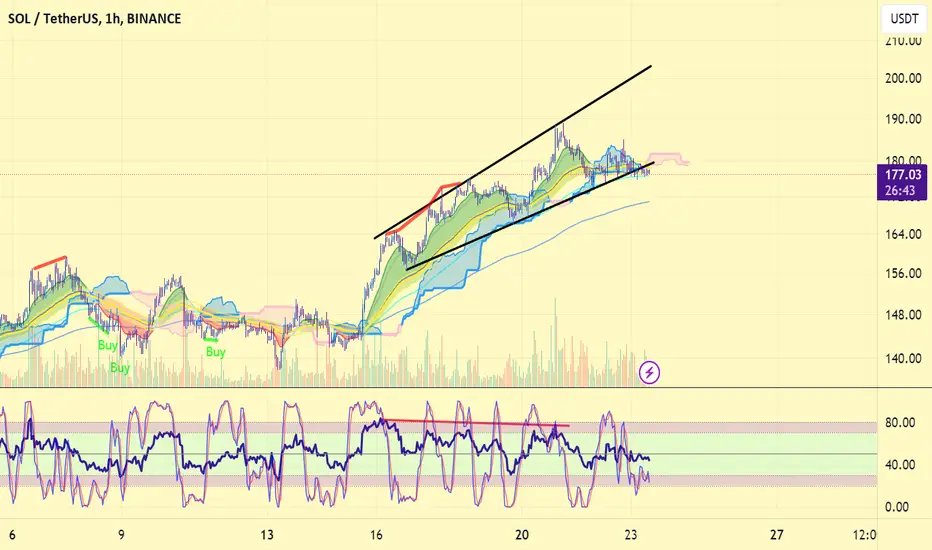
Will Solana continue his upward movement?📊 According to the buying pressure in the market, if the $183 range breaks upwards and the price stabilizes above it, the price may increase to the $190 range🎯, and in the case of strength, the $200 range🎯🎯.
📊 Otherwise, the price may drop to $160.

SOL : go to big price📊Analysis by AhmadArz:
🔍Entry: 165.66 - 159.85
🛑Stop Loss: 153.05
🎯Take Profit: 173.94 - 184.54 - 194.83 - 203.74
🔗"Uncover new opportunities in the world of cryptocurrencies with AhmadArz.
💡Join us on TradingView and expand your investment knowledge with our five years of experience in financial markets."
🚀Please boost and💬 comment to share your thoughts with us!

SOL/USDT: Firm Above Key Level, Targeting New Highs, 1:2 R/RSOL/USDT has completed its correction phase and is now solidly positioned above a crucial mirror level, signaling a strong buy opportunity. This setup indicates potential for price advancement towards updating local highs, supported by a favorable 1:2 risk/reward ratio. The recent consolidation above the support level adds confidence in the upward trajectory. Traders should consider entering at the current market price to capitalize on this emerging bullish momentum.

SOLUSDT LONG Hello dear all i hope you are all doing well
Dear mate we are on bullish market as soon as possible we will hit 200$ again
the chart is clear just open and watch it
than you for your time

SOLUSDT Price Potentially Increasing | ForecastHello there,
Above the 180.08 level, the SOLUSDT has the potential to increase up to 186.36 against the 176.83 area zone.
The main price target is 186.36, extended to 187.51 for a bias of 191.06; Fibonacci levels are taken from the low of 174.44.
Happy Trading
K.

#SOL Illuminating the Path: Get In on the Buy Action Today!**Technical Analysis Chart Description:**
Welcome to my Technical Analysis charts on TradingView! Before we dive into the analysis, it's essential to understand some important warnings:
1. **Subjectivity Alert:** Technical analysis involves interpreting market data and chart patterns, which can be subjective. Different analysts may interpret the same data differently, leading to varied conclusions.
2. **Historical Performance Doesn't Guarantee Future Results:** Past price movements do not guarantee future price movements. While historical data can provide insights, it's crucial to consider other factors that could influence price action.
3. **Risk of False Signals:** Technical indicators and chart patterns can produce false signals, leading to potential losses if relied upon blindly. Always cross-verify signals with other indicators or fundamental analysis.
4. **Market Volatility:** Crypto markets are highly volatile and can experience rapid price fluctuations. Be prepared for sudden and unexpected price movements, which may invalidate previously identified patterns.
5. **Risk Management:** Proper risk management is essential. Never invest more than you can afford to lose, and consider using stop-loss orders to mitigate potential losses.
6. **Emotional Bias:** Avoid emotional decision-making based on short-term price movements. Stick to your trading plan and strategy, and don't let fear or greed influence your decisions.
**Disclaimer for Crypto Trading:**
Trading cryptocurrencies carries inherent risks, and it's important to understand the following:
Cryptocurrency markets are highly speculative and can be subject to extreme volatility. Prices can fluctuate significantly within short periods, leading to substantial gains or losses.
Investing in cryptocurrencies involves the risk of total loss of capital. Unlike traditional assets, cryptocurrencies are not backed by any tangible assets or central authority, making them inherently risky.
Regulatory uncertainty and market manipulation are additional risks associated with cryptocurrency trading. Regulatory changes or negative news can have a significant impact on prices.
This analysis is for informational purposes only and should not be construed as financial advice. It's crucial to conduct thorough research and consult with a qualified financial advisor before making any investment decisions in the cryptocurrency markets.
By using this analysis, you acknowledge and accept the risks associated with cryptocurrency trading and agree to trade at your own discretion. The author of this analysis shall not be held responsible for any losses incurred as a result of using the information provided.

SOL to Fall Macro backdrop:
1. Fed has signaled no rate cuts this year = less liquidity for risk/growth assets
2. DXY looks ready to rise = softness for dollar alternatives i.e. BTC & Gold
3. Geopolitical tensions & risk of war leading to uncertainty
Bearish Chart Evidence:
1. 3 consecutive lower lows
2. Upside channel break
3. RSI below 50
4. MACD Convergence
5. Volume reduction
6. Money Flow Index moving down
7. Larssen Line turned bearish
Potential patterns playing out:
Potential repeating cup & handle fractal
Potential 5 wave elliot correction
If $118 support is lost, cup & handle could be in play with an ultimate target of $40... but there are many levels between where it can find support
$118 -$120 level coincides with bull market support band. If we lose this level, expect further downside to next support at $80.
$$118 - $80 roughly corresponds with golden pocket fib retracement on weekly timeframe. High chance of reclaiming this zone to move higher.
Targets:
1st Target: $118
2nd Target: $100
3rd Target: $80

$SOL price will decide #sol #solana chart has formed ascending megaphone channel for days. A tiny deviation is occuring, but with today's news will bring #solusd price to 200$ (top of the channel) or cause a dump. Not financial advice.
SOLUSDT Anticipated Return to Previous All-Time Highs Imminent!!After a sustained period of growth followed by a healthy retracement,SOLUSDT is gearing up for a significant upward movement. Market indicators suggest that the cryptocurrency has undergone a necessary correction, setting the stage for a resurgence towards its previous all-time highs. With investor sentiment buoyant and technical analyses signaling bullish momentum, SOLUSDT appears poised to reclaim its former glory and potentially surpass previous ATH levels.
SOLUSDT (1D Chart) Technical analysis
SOLUSDT (1D Chart) Currently trading at $137
Buy level: Above $132
Stop loss: Below $105
TP1: $150
TP2: $175
TP3: $210
TP4: $260
Max Leverage 2x
Always keep Stop loss
Follow Our Tradingview Account for More Technical Analysis Updates, | Like, Share and Comment Your thoughts

Sol SpeculationI understand we have had a lot of bullish news and a potential for a rally and everyone is anticipating a move towards the up side but looks like we are trading in a range and a healthy pull back before the move up is still necessary.
This is just my opinion.

SOL dumps incomingSOLana broke down the upper trend, looking bearish right now.
Time to open a short position.
Target 140$ 100$ 50$

SOL, Break of the Previous Ceiling or Start of Wave C?Hello dear friends, I hope you are all well.
Important note: First, read the previous analysis I shared on Solana, then proceed to this analysis.
For several reasons, I see Solana as bearish:
1. Thankfully, the previous wave count analysis was correct (meaning it completed the 5 main Elliott waves and then entered the corrective phase).
One thing I realized today is this:
In the previous analysis, I did the wave count in the weekly time frame, but I shared the roadmap and type of decline in the 4-hour time frame.
When I look at the chart in the weekly time frame, this deep correction is only wave A, and we are now in the structure of wave B.
--------------
The higher wave B goes, the less the decline of wave C will be.
For example, if the end of wave B is around $183, the decline of wave C will be between $89 and $63.
--------------
In the Solana dominance chart (SOL.D), the period from June 7 to June 17 is the most important time area.
It is likely that during this period, Solana's dominance will undergo a change.
Structurally, I see nothing but a repetitive Elliott cycle.
--------------
In the RSI indicator (SOL.D), the main weekly trend has broken, and we are heading towards a pullback decline.
If there is any change in the chart structure, the analysis will be updated.
If I identify a precise bearish pattern or timing, I will update the analysis.
Thank you for taking the time to read.
I hope you have profitable trades.

SOLUSDT Elliott Waves AnalysisHello friends.
Please support my work by clicking the LIKE button👍(If you liked). Also i will appreciate for ur activity. Thank you!
Everything on the chart. (update)
Entry: (first buy 120, and still have limit order at 95)
Targets: 185 - 250 - 33
after first target reached move ur stop to breakeven
Stop: (depending of ur risk).
ALWAYS follow ur RM
risk is justified
Good luck everyone!
Follow me on TRADINGView, if you don't want to miss my next analysis or signals.
It's not financial advice.
DYOR!

Sol bullish buy setup ideaSol is very strong as always and in bullish trend overall. That's why I will look for long oppertunities. As we can a clearly on chart a B O S in bullish side. So we will look for order block with fvg and also having sell side liquidity build up. And we got that around 175$ area which is my POI for long position.

wow We see a very nice growth of 1080% from the bottom of the green channel and
from the strong green support zone.
Now there is a solid red resistance band in front of it.
Possible failure of this band means the next beautiful growth

SOLUSDT IDEAHey traders hope you are enjoying our analysis. Now we are here again with a new trading opportunity. We will discuss today about SOL
SOL Finally Hits Our Target +20% Profit Done ✅
Congratulations 🎉🎉🎉

SOLUSDT IDEAThis is just simple trading idea draw into chart using labels and lines. Please use it as educational purpose and you are free to modify any
