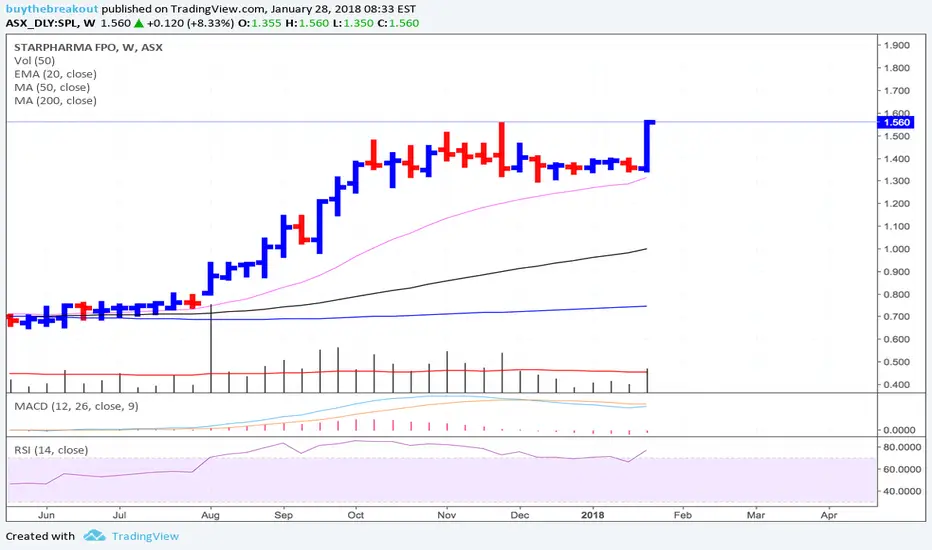
$SPL 0.145 on pump news $52m MCRange (creation) trade on news of some description.
ST target in blue.
Ill be very surprised if this doesnt at least close HOD
350m SOI
US listing SPHRY
Holding from 145
Starpharma Holdings Ltd.
No trades
Next report date
—
Report period
—
EPS estimate
—
Revenue estimate
—
−0.0158 USD
−6.57 M USD
3.23 M USD
378.86 M
About Starpharma Holdings Limited
Sector
Industry
CEO
Cheryl Maley
Website
Headquarters
Abbotsford
Founded
1997
IPO date
Sep 28, 2000
Identifiers
2
ISIN AU000000SPL0
Starpharma Holdings Ltd. engages in the research, development, and commercialization of dendrimer products for pharmaceutical and healthcare applications. Its pipeline and products include SN38, cabazitaxel, docetaxel, radiopharmaceuticals, antibody-drug conjugates, and anti-infective products. The company was founded in 1996 and is headquartered in Abbotsford, Australia.
Related stocks

$SPL ASX - Starpharma Holdings might be a small playStarpharma Holdings Limited (SPL) is a biotechnology company that engages in the development of dendrimer products for pharmaceutical, life science and other applications. SPL's underlying technology is built around dendrimers, a type of synthetic nanoscale polymer that is highly regular in size and


Speculative Stockpick #2SPL is a highly speculative stock (refer VectorVest Strategic Investment Matrix) with RV <1.0 and RS = 1.0.
We only consider this stock for very short term because of its explosive potential… A strong RT value.
The RT value is trending up since the confirmation of bullish abandoned baby which is
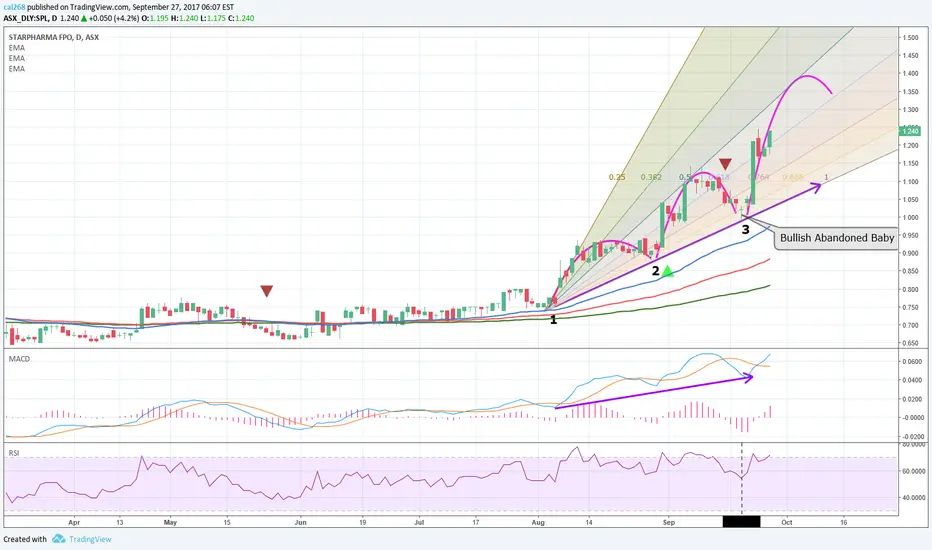
SPL.AX Starphrama poised for future gainsStarpharma is posting some nice technicals that may be indicative of another impulse move
See previous analysis on Starpharma

Vectorvest VS Technical AnalysisVectorvest VS technical analysis
Strategy | Entry Price
Midas Touch MA RT(40) crossover | $0.69
Midas Touch MA Stop (10 & 60 ) crossover | $0.74
DEW Crossover | $0.69
MACD Crossover

See all ideas
Summarizing what the indicators are suggesting.
Oscillators
Neutral
SellBuy
Strong sellStrong buy
Strong sellSellNeutralBuyStrong buy
Oscillators
Neutral
SellBuy
Strong sellStrong buy
Strong sellSellNeutralBuyStrong buy
Summary
Neutral
SellBuy
Strong sellStrong buy
Strong sellSellNeutralBuyStrong buy
Summary
Neutral
SellBuy
Strong sellStrong buy
Strong sellSellNeutralBuyStrong buy
Summary
Neutral
SellBuy
Strong sellStrong buy
Strong sellSellNeutralBuyStrong buy
Moving Averages
Neutral
SellBuy
Strong sellStrong buy
Strong sellSellNeutralBuyStrong buy
Moving Averages
Neutral
SellBuy
Strong sellStrong buy
Strong sellSellNeutralBuyStrong buy
Displays a symbol's price movements over previous years to identify recurring trends.
Frequently Asked Questions
The current price of SPHRF is 0.2400 USD — it has decreased by −13.48% in the past 24 hours. Watch Starpharma Holdings Ltd. stock price performance more closely on the chart.
Depending on the exchange, the stock ticker may vary. For instance, on OTC exchange Starpharma Holdings Ltd. stocks are traded under the ticker SPHRF.
SPHRF reached its all-time high on May 1, 2012 with the price of 1.9200 USD, and its all-time low was 0.0540 USD and was reached on Dec 18, 2024. View more price dynamics on SPHRF chart.
See other stocks reaching their highest and lowest prices.
See other stocks reaching their highest and lowest prices.
SPHRF stock is 15.58% volatile and has beta coefficient of 1.96. Track Starpharma Holdings Ltd. stock price on the chart and check out the list of the most volatile stocks — is Starpharma Holdings Ltd. there?
Today Starpharma Holdings Ltd. has the market capitalization of 145.85 M, it has decreased by −1.55% over the last week.
Yes, you can track Starpharma Holdings Ltd. financials in yearly and quarterly reports right on TradingView.
Starpharma Holdings Ltd. is going to release the next earnings report on Mar 3, 2026. Keep track of upcoming events with our Earnings Calendar.
SPHRF net income for the last half-year is −3.02 M USD, while the previous report showed −3.34 M USD of net income which accounts for 9.36% change. Track more Starpharma Holdings Ltd. financial stats to get the full picture.
No, SPHRF doesn't pay any dividends to its shareholders. But don't worry, we've prepared a list of high-dividend stocks for you.
As of Feb 14, 2026, the company has 40 employees. See our rating of the largest employees — is Starpharma Holdings Ltd. on this list?
EBITDA measures a company's operating performance, its growth signifies an improvement in the efficiency of a company. Starpharma Holdings Ltd. EBITDA is −8.93 M USD, and current EBITDA margin is −370.79%. See more stats in Starpharma Holdings Ltd. financial statements.
Like other stocks, SPHRF shares are traded on stock exchanges, e.g. Nasdaq, Nyse, Euronext, and the easiest way to buy them is through an online stock broker. To do this, you need to open an account and follow a broker's procedures, then start trading. You can trade Starpharma Holdings Ltd. stock right from TradingView charts — choose your broker and connect to your account.
Investing in stocks requires a comprehensive research: you should carefully study all the available data, e.g. company's financials, related news, and its technical analysis. So Starpharma Holdings Ltd. technincal analysis shows the neutral today, and its 1 week rating is neutral. Since market conditions are prone to changes, it's worth looking a bit further into the future — according to the 1 month rating Starpharma Holdings Ltd. stock shows the neutral signal. See more of Starpharma Holdings Ltd. technicals for a more comprehensive analysis.
If you're still not sure, try looking for inspiration in our curated watchlists.
If you're still not sure, try looking for inspiration in our curated watchlists.