SMPH Chart Analysis Aug 26, 2025First off, SMPH is a bluechip stock in PSE.
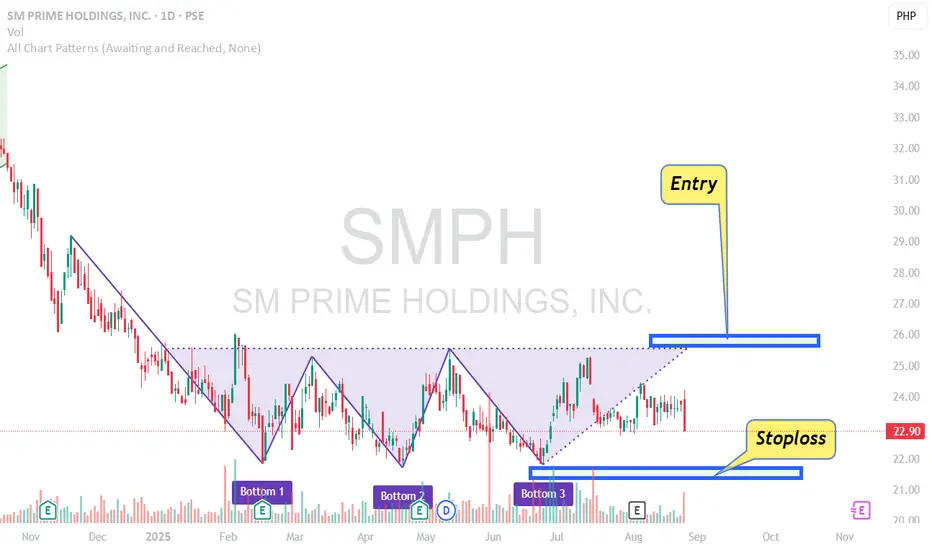
The price of SMPH made a triple bottom chart pattern. Triple bottom is a bullish reversal pattern. The entry is on the break of the neckline. You put a stoploss below the right (3rd) shoulder after entry.
Triple bottom chart pattern is a "prove me your s
SM Prime Holdings, Inc.
No trades
Next report date
—
Report period
—
EPS estimate
—
Revenue estimate
—
0.0290 USD
783.95 M USD
2.41 B USD
10.67 B
About SM Prime Holdings, Inc.
Sector
Industry
Website
Headquarters
Pasay
Founded
1994
IPO date
Jul 5, 1994
Identifiers
3
ISIN PHY8076N1120
SM Prime Holdings, Inc. develops, conducts, operates and maintains modern commercial shopping centers. It operates through the following segments: Malls, Residential, Commercial, and Hotels and Convention Centers. The Mall segment develops, conducts, operates and maintains the business of modern commercial shopping centers and all businesses related thereto such as the conduct, operation and maintenance of shopping center spaces for rent, amusement centers, or cinema theaters within the compound of the shopping centers. The Residential and Commercial segments are involved in the development and transformation of major residential, commercial, entertainment and tourism districts through sustained capital investments in buildings and infrastructure. The Hotels and Convention Centers segment engages in and carry on the business of hotel and convention centers and operates and maintains any and all services and facilities incident thereto. The company was founded on January 6, 1994 and is headquartered in Pasay, Philippines.
Related stocks
SMPH Possible Trend ReversalAfter months of downtrend, SMPH seems to be somehow recovering from its bearish sentiment. From downtrend to sideways
Confluence
Macro: Shift from downtrend to sideways
Daily chart: higher lows
RSI: higher lows
Short term outlook: Looking like a 1 month short term uptrend.
Other Notes
Possibly loo

SMPH Update as of 6/15/2023I have sold all my shares in this company for now as it does not meet my expectations of rising value. I will keep an eye on the stock price and may decide to buy or sell again.

SMPH Update as of 6/8/2023Buy - I initiated a bid to buy 100 units of SMPH shares today as we anticipate a potential Php 5.00 upside from its current 33.55 closing price. The stock appeared to have reached its support area at around Php 33/share and its currently consolidating in that area which supports this decision.

SMPH - SM Prime Holdings InitiationUpdate:
I apologize for the long break. I had a lot on my plate with working full time and moving from my rented apartment to my own home. It took up all my time and energy to generate and post my trading ideas. But now I'm back with a new trading idea.
Analysis:
I'm starting to cover SMPH becaus

See all ideas
Summarizing what the indicators are suggesting.
Neutral
SellBuy
Strong sellStrong buy
Strong sellSellNeutralBuyStrong buy
Neutral
SellBuy
Strong sellStrong buy
Strong sellSellNeutralBuyStrong buy
Neutral
SellBuy
Strong sellStrong buy
Strong sellSellNeutralBuyStrong buy
An aggregate view of professional's ratings.
Neutral
SellBuy
Strong sellStrong buy
Strong sellSellNeutralBuyStrong buy
Neutral
SellBuy
Strong sellStrong buy
Strong sellSellNeutralBuyStrong buy
Neutral
SellBuy
Strong sellStrong buy
Strong sellSellNeutralBuyStrong buy
Displays a symbol's price movements over previous years to identify recurring trends.
Frequently Asked Questions
The current price of SPHXF is 0.4000 USD — it has increased by 30.13% in the past 24 hours. Watch SM Prime Holdings, Inc. stock price performance more closely on the chart.
Depending on the exchange, the stock ticker may vary. For instance, on OTC exchange SM Prime Holdings, Inc. stocks are traded under the ticker SPHXF.
We've gathered analysts' opinions on SM Prime Holdings, Inc. future price: according to them, SPHXF price has a max estimate of 0.71 USD and a min estimate of 0.35 USD. Watch SPHXF chart and read a more detailed SM Prime Holdings, Inc. stock forecast: see what analysts think of SM Prime Holdings, Inc. and suggest that you do with its stocks.
SPHXF reached its all-time high on Feb 11, 2022 with the price of 0.9500 USD, and its all-time low was 0.0800 USD and was reached on May 18, 2004. View more price dynamics on SPHXF chart.
See other stocks reaching their highest and lowest prices.
See other stocks reaching their highest and lowest prices.
SPHXF stock is 23.35% volatile and has beta coefficient of 1.81. Track SM Prime Holdings, Inc. stock price on the chart and check out the list of the most volatile stocks — is SM Prime Holdings, Inc. there?
Today SM Prime Holdings, Inc. has the market capitalization of 10.53 B, it has increased by 1.95% over the last week.
Yes, you can track SM Prime Holdings, Inc. financials in yearly and quarterly reports right on TradingView.
SM Prime Holdings, Inc. is going to release the next earnings report on Feb 23, 2026. Keep track of upcoming events with our Earnings Calendar.
SPHXF earnings for the last quarter are 0.01 USD per share, whereas the estimation was 0.01 USD resulting in a −3.51% surprise. The estimated earnings for the next quarter are 0.01 USD per share. See more details about SM Prime Holdings, Inc. earnings.
SM Prime Holdings, Inc. revenue for the last quarter amounts to 604.64 M USD, despite the estimated figure of 558.83 M USD. In the next quarter, revenue is expected to reach 642.56 M USD.
SPHXF net income for the last quarter is 218.63 M USD, while the quarter before that showed 226.85 M USD of net income which accounts for −3.62% change. Track more SM Prime Holdings, Inc. financial stats to get the full picture.
Yes, SPHXF dividends are paid annually. The last dividend per share was 0.01 USD. As of today, Dividend Yield (TTM)% is 2.25%. Tracking SM Prime Holdings, Inc. dividends might help you take more informed decisions.
SM Prime Holdings, Inc. dividend yield was 1.91% in 2024, and payout ratio reached 30.35%. The year before the numbers were 1.05% and 24.95% correspondingly. See high-dividend stocks and find more opportunities for your portfolio.
As of Feb 14, 2026, the company has 13.75 K employees. See our rating of the largest employees — is SM Prime Holdings, Inc. on this list?
EBITDA measures a company's operating performance, its growth signifies an improvement in the efficiency of a company. SM Prime Holdings, Inc. EBITDA is 1.50 B USD, and current EBITDA margin is 59.17%. See more stats in SM Prime Holdings, Inc. financial statements.
Like other stocks, SPHXF shares are traded on stock exchanges, e.g. Nasdaq, Nyse, Euronext, and the easiest way to buy them is through an online stock broker. To do this, you need to open an account and follow a broker's procedures, then start trading. You can trade SM Prime Holdings, Inc. stock right from TradingView charts — choose your broker and connect to your account.
Investing in stocks requires a comprehensive research: you should carefully study all the available data, e.g. company's financials, related news, and its technical analysis. So SM Prime Holdings, Inc. technincal analysis shows the sell today, and its 1 week rating is sell. Since market conditions are prone to changes, it's worth looking a bit further into the future — according to the 1 month rating SM Prime Holdings, Inc. stock shows the sell signal. See more of SM Prime Holdings, Inc. technicals for a more comprehensive analysis.
If you're still not sure, try looking for inspiration in our curated watchlists.
If you're still not sure, try looking for inspiration in our curated watchlists.