BUY NAS100Support and Resistance levels been respected for a while, historic movements showing valid supply and demand zones.
Thanks
Don
NDX trade ideas

A short term analysisUs 1 year bond is showing a strength which means dollar will or might do the same thing, expenditure of dollar will go to stock etc, on the other hand, the stock VALUE will be allocated to paper money DOLLAR
Not a financial adviice

Nas100 bears takeover Here's the possible senerios i like to see play out next week.
Bearish continuation: after a long run with the bulls the retrecement has been strong and we might see price drop lower to the 0,5 - 0.618 fib level there we can find order blocks and FVG
But lets see if price will respect the 1 hr order block above at level 18.624,00
If not the bulls might take over and will keep pushing price higher

3 Day and 1 Day chart of the NDX PSA
I really don't post much anymore at but I do trade.
This is PSA is showing you that will maybe happening.
The two percent down and up routine leaves you with a daily doji but the Heiken Ashi candle on the left paints a most honest picture. One day chart on left.
Market was strong on open today NYSE TICK was 800 to 1000 and was very positive on open, and this was the dumped on. Market and then returned like it never happened. Not normal price action.
The Nikkei USD contract NKD1 didn't even move as the NDX sold off 2% it usually moves in sympathy with US Indices and usually more volatile.
Since at the end of the day the NDX closed flat. They always know.
Bottom line that one day Heiken Ashi is very negative, not that a spinning top - doji is positive.
The 3 day chart shows clearly there is divergence on my indicator to boot.
If we get to a good sell off we can return to 17688 there is a fair value gap to fill there, and is close to the .618 Fib level on daily.

CHART BREAKDOWN NASDAQ: Key Levels, Targets and Thoughts!Brief Description🖊️:
The chart provides insights into critical market levels, emphasizing an essential demand zone (low-risk buy zone) spanning from 18,264 to 18,240. Additionally, a medium-risk sell zone between 18,784 to 18,764, respectively, is highlighted.
Things I Have Seen👀:
Important Demand Zone🟢: Identified between 18,264 to 18,240, serving as a low-risk buy.
Medium-Risk Sell Zone🟠: Noted between 18,784 to 18,764, suggesting another area with moderate risk for potential buying positions.
Bullish Targets📈:
18,350: Possible retracement area.
18,470: Possible retracement area.
18,720: Possible retracement area.
18,764: Significant supply zone.
Ultimate Target: 18,950- Liquidity area.
Bearish Targets📉:
18,730: Possible retracement area.
18,650: Possible retracement area.
18,500: Possible retracement area.
18,400: Possible retracement area.
18,264: Essential Demand Zone
Ultimate Target: 18,200- Laying Low Liquidity
What's Important Now❗
Currently, the crucial approach is to wait and observe the price action at this level. We need to assess how the market reacts before considering any decisive moves. Stay observant and responsive to real-time developments in the market.

US 100 SELLI want to try this sell, in my opinion probable reversal.
The real key regardless of any strategy is to have a decent risk/reward .
You win and you lose , so be cautious.
No financial advice, do your own research


Pre- Market analysis for first week of June 2024Either as soon as Sunday reopens
or perhaps London KZ /NY KZ,
I'm expecting for price to come tap
the low from Friday -last day of May.
OFC wait for a 1-5min BOS upward
for confluence on entry technique.
Expecting it to eventually take May's
high but will just target this upper
area. I think 500 pips will do me just
fine.


NASDAQ Another 2 weeks of consolidation possibleNasdaq (NDX) made the bullish break-out that we largely expected as described on our previous idea (May 15, see chart below) and almost hit our 19100 Target:
Right now we see a short-term pull-back, which based on the November - December 2023 fractal (green ellipse), should be at worst a 2 week consolidation. The 1D RSI also shows that symmetrically we should be at a point similar to December 06 2023.
That fractal then rose for a Higher High on the 2.236 Fibonacci extension. As a result, our medium-term Target is now set at 19900 (just under the 2.236 Fib and top of the 1.5 year Channel Up).
-------------------------------------------------------------------------------
** Please LIKE 👍, FOLLOW ✅, SHARE 🙌 and COMMENT ✍ if you enjoy this idea! Also share your ideas and charts in the comments section below! This is best way to keep it relevant, support us, keep the content here free and allow the idea to reach as many people as possible. **
-------------------------------------------------------------------------------
💸💸💸💸💸💸
👇 👇 👇 👇 👇 👇

Melt-up in securitiesHaving handled the decline, the markets now seem to be on the verge of a melt-up. We are already seeing it in European securities and industrials. However, I think the risk reward is best in Nasdaq, where I think we will trade at least 15% by the end of Q3. Looking at some data, it seems that fund managers are again underinvested in equities, which limits the downside.
I would position with a tactical long in NDQ-futures. With a risk/reward of 5 - risking 10% of my capital.

Us100 Important Levels + Gann GridHello Dear Traders...
On the Chart Important levels for US100 Short term
Horizontal lines are Support/Resistance
Watch for Price action around these levels.
Also the Jinny Gann Grid, Giving you Expected Channels,Trends!
Wish you Best of Luck Trading
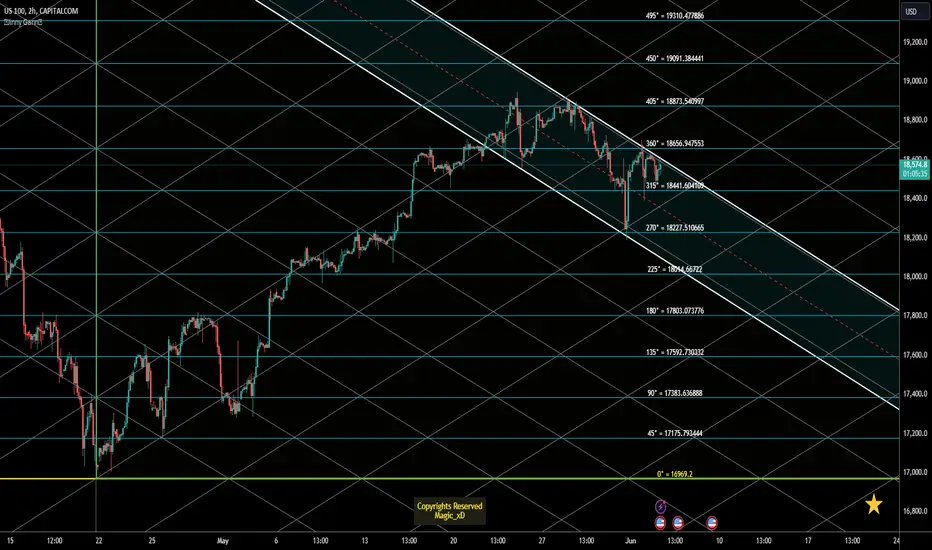
CHART BREAKDOWN NASDAQ: Key Levels, Targets and Thoughts!Trade Update: NASDAQ
We have some great news on our recent NASDAQ trade! 💲
After analyzing the market conditions and identifying a solid setup, our trade has successfully Hit Take Profit 3 (TP3). This made sure that 100% of our positions have been secured and cashed out, allowing us to lock in ALL profits.
Following this, we closed this trade fully with a Risk to Reward of 10! This strategy not only protects our capital but also gives us the opportunity to capture further potential gains.
Stay tuned for more updates and happy trading! 🚀


Nasdaq Not Over Yet !Hi mates sharing a long view on Nasdaq as price break resistance (18350) and sustaining very well above and by the today's candle price breached the high of breakout candle too which is a good sign for resistance breakout so from here onwards i am looking some more upside movement in coming sessions friends. Traget meausured from the swing high to swing low made before this breakout and by the rising resistance line too and it seems logical too me.
Breakout retest- So as we can see that a proper breakout retest not happened so far after breakout which could provide the best entry as we can minimize our risk in any of trade by these type of retest entries as price earlier retested too it's breakout mentioned on provided chart, Rest i will update idea accordingly whenever needed and good to share anything about this publication.
This idea is meant for only educational purpose this not any kind of trading or investment advice.
Best Regards- Amit

NASDAQSo we hit ATH again! Good work to all those who bought all the way up.
Now, it's time us bears take over.
Price moved up very aggressively and is due for a correction or relief.
We formed a nice double top which is indicating that the bulls are done and ready to step down.
Selling at the current level is not a bad move. I have opened a short with a tight SL.
Let's see what impact the news and NFP will have moving towards the end of the week.
Good luck, have fun!

history repeats itselfnas100 daily chart for educational use only,as we can see previously how price reacted after it broke a major level.creating higher highs and higher lows,it is expected for price to continue in that pattern

Us100_shI believe the price has reached an overbought stage, and we might see a strong decline towards the specified areas. Currently, the price is in a distribution zone. We could witness a rapid surge to break the selling positions, followed by a continuation of the decline. Therefore, my stop-loss is set to be triggered by the closure of a 15-minute candle above the specified area shown in the image to stop the loss.

Nasdaq starts its vacationMixed results are expected this day as we begin a new trading month and WallStreet indices start with solid gains in the month of May. The S&P500 benchmark is up 17 points or about 0.3%. The Nasdaq Composite was up 156 points (0.9%), and the Dow Jones Industrial Average, composed of 30 top companies, fell 25 points (-0.1%). The PCE data showed a slight cooling of the U.S. economy, which has encouraged the FED to possibly cut interest rates in September. The S&P500 rose 0.8% to 5,277.51 points on Friday, while the Dow Jones rose 0.8% to 38,686.32 points and Nasdaq lagged on weakness in tech companies closing flat at 16,735.02 points.
May nonfarm payrolls are a key data point on Friday. Fed traders' consensus was 47% for a 25 basis point cut in September, in conjunction with a 45% probability that it will maintain its monetary policy according to CME Fed Watch. The central bank is expected to hold rates steady, and Fed officials continue to call for patience with rate cuts looking for evidence of a return to inflation stability on the 2% path. Already last Monday Neel Kashkari of the Minneapolis Fed echoed this by reporting that they could remain unchanged for an “extended” period of time.
If we look at the Nasdaq chart (Ticker AT: USATEC) the fact is that on Friday the first price resistance was pierced at the 18,197 area returning to the support zone of May 23rd. The price bell has generated a price control zone at 18,820 points with a dual bell marking the second lower bell around 18,626 points. The RSI is currently oversold at 41.60%, it will not be uncommon this month to see a price drop to Friday's second resistance zone. And a return to the mean. The truth is that this month can be quite weak in terms of sales in many technology sectors and Nasdaq has been practically dragged down by the Magnificent 7 and not so much by the rest that have barely experienced a palpable growth.
Ion Jauregui - ActivTrades Analyst
*******************************************************************************************
The information provided does not constitute investment research. The material has not been prepared in accordance with the legal requirements designed to promote the independence of investment research and such should be considered a marketing communication.
All information has been prepared by ActivTrades ("AT"). The information does not contain a record of AT's prices, or an offer of or solicitation for a transaction in any financial instrument. No representation or warranty is given as to the accuracy or completeness of this information.
Any material provided does not have regard to the specific investment objective and financial situation of any person who may receive it. Past performance is not reliable indicator of future performance. AT provides an execution-only service. Consequently, any person acing on the information provided does so at their own risk.

NAS Buy Idea 5/19/24Looking for NAS to pull back no farther than the somewhere around 18168.8 (Mid-Point of the weekly consolidation + monthly bullish channel mid-point) and then continue bullish to the top of the weekly bullish channel that price is currently in around 19044
**This is for educational purposes only and this is not financial advice because I am not a financial advisor.**

NASDAQ Analysis - Selling OpportunityNASDAQ Analysis - Selling Opportunity
Open: 18,883
SL: 19,0000
TP: 18,480

CHART BREAKDOWN US30: Key Levels, Targets and Thoughts!Trade Update: NASDAQ
We have some great news on our recent NASDAQ trade! 💲
After analyzing the market conditions and identifying a solid setup, our trade has successfully Hit Take Profit 2 (TP2). This made sure that 80% of our positions have been secured and cashed out some of our gains, allowing us to lock in profits and reduce risk.
Following this, we moved our stop loss to TP1 to ensure no loss on the remaining position. This strategy not only protects our capital but also gives us the opportunity to capture further potential gains with zero risk on the table and cashing out on TP3s.
Stay tuned for more updates and happy trading! 🚀

USNAS100 (ADP _ ISM)USNAS100
Tendency the price is under bearish pressure 18,800
Turning level : The turning level between18,715 and 18,800 ,so as long as the price below this level, there will be a bearish trend
resistance level : Breaking the turning level 18,800 , will reach 18,895 , and then will have anew peaks
support level : The trading stabilizing below 18,800, the price will reach the support level of 18,430 and18,234
corrective level : price will attempt between 18,717 and 18,800 , correct itself before falling
