SPX500 – Fed Speeches to Drive Next BreakoutSPX500 – Technical Outlook
Markets remain focused on Fed policy signals after last week’s rate cut and a wave of upcoming Fedspeak, while shrugging off the Trump administration’s H-1B visa crackdown. With traders pricing in further easing by year-end, comments from Fed officials will drive sentiment and could trigger sharp moves in U.S. indices.
Price Action
SPX500 is currently showing bearish momentum while trading below the pivot zone, reflecting investor caution ahead of key Fed speeches.
Bearish Path:
As long as price remains below the 6,663 pivot, downside pressure persists toward 6,634.
A confirmed 1H close below 6,634 would open the way for deeper losses toward 6,590.
Bullish Path:
A confirmed 1H candle above 6,684 would invalidate the bearish bias and signal fresh bullish momentum, targeting 6,700 → 6,742.
Key Levels
Pivot: 6,663
Resistance: 6,684 – 6,700 – 6,742
Support: 6,634 – 6,619 – 6,590
Trade ideas

Hellena | SPX500 (4H): LONG to resistance area of 6700.Colleagues, I think we should expect the upward movement to continue. The upward impulse is not over yet, but I think we may see a correction to the 6500 area, then I expect the upward movement to continue to the 6700 area, which is a pretty strong psychological level and is the area of 50% levels of Fibonacci extension.
Manage your capital correctly and competently! Only enter trades based on reliable patterns!

The Future of World Trade with CBDCs1. The Mechanics of CBDCs in Global Trade
Before understanding the future, we must grasp how CBDCs function in practice within the trade ecosystem.
1.1 What are CBDCs?
A CBDC is a digital version of a sovereign currency, operating on secure digital ledgers (sometimes blockchain-based, sometimes centralized databases). They can exist in two forms:
Retail CBDCs: For individuals and businesses, used like cash or digital wallets.
Wholesale CBDCs: For interbank and institutional settlements, especially useful for cross-border trade.
For world trade, wholesale CBDCs are more relevant since they handle large, cross-border payments between corporations, governments, and central banks.
1.2 Current Problems in International Payments
Today, cross-border trade payments are often:
Slow: Transactions can take days due to intermediary banks.
Expensive: Fees are high, especially for developing nations.
Opaque: Hard to track payments and verify authenticity.
Fragmented: Reliant on SWIFT, correspondent banks, and dollar dominance.
1.3 How CBDCs Could Solve These
CBDCs could:
Enable instant cross-border settlements, reducing time from days to seconds.
Lower transaction costs by eliminating intermediaries.
Provide real-time tracking, reducing fraud and money laundering.
Reduce dependence on the SWIFT system and the U.S. dollar.
For example, if a Brazilian exporter sells soybeans to India, payment could be made directly via India’s Digital Rupee and Brazil’s CBDC, using a cross-CBDC bridge. No dollar conversion, no delays, no excessive fees.
2. Opportunities for Efficiency and Transparency
CBDCs open doors for significant efficiency gains in trade.
2.1 Faster Settlements
Today’s trade finance often locks up trillions of dollars in delayed settlements. CBDCs would free up liquidity, allowing businesses to reinvest faster and boost economic growth.
2.2 Lower Costs
By cutting out multiple banking intermediaries, CBDCs reduce costs for exporters and importers. This is particularly beneficial for small and medium enterprises (SMEs) in emerging markets, who often face the brunt of high fees.
2.3 Enhanced Transparency
With digital ledgers, every trade payment becomes traceable. This reduces corruption, black-market transactions, and money laundering. Governments can monitor international flows with precision.
2.4 Smarter Contracts
CBDCs could integrate with smart contracts — digital agreements that automatically execute when conditions are met. Imagine a shipment of coffee beans from Ethiopia: the CBDC payment could be released instantly once sensors confirm delivery at the port.
2.5 Financial Inclusion
Millions of unbanked traders and businesses in Africa, Asia, and Latin America could access international markets more easily through CBDC-enabled wallets, bypassing traditional banks.
3. Risks and Challenges of CBDCs in Trade
Despite the opportunities, CBDCs also bring significant risks.
3.1 Technology and Cybersecurity Risks
CBDCs will rely on advanced digital infrastructure. Cyberattacks on a CBDC system could paralyze trade flows or create financial chaos. If hackers compromise a major CBDC like the Digital Yuan or Digital Dollar, the ripple effect could be catastrophic.
3.2 Loss of Privacy
While CBDCs enhance transparency, they also give governments unprecedented surveillance powers. Every transaction can be tracked, raising concerns over trade confidentiality. Companies may hesitate to reveal sensitive financial data to foreign governments.
3.3 Geopolitical Fragmentation
Instead of unifying global payments, CBDCs might fragment them into competing blocs. For example:
China may push the Digital Yuan for Belt & Road trade.
The U.S. may push a Digital Dollar.
Europe may push the Digital Euro.
This could create currency blocs that compete for dominance, rather than seamless global integration.
3.4 Impact on Dollar Dominance
The U.S. dollar currently accounts for nearly 90% of global trade settlements. CBDCs might erode this dominance if countries start trading in their local CBDCs. While this reduces U.S. hegemony, it also risks creating currency volatility and trade inefficiencies.
3.5 Adoption Barriers
Not all nations have the same level of digital infrastructure. Poorer nations might struggle to adopt CBDCs quickly, widening the gap between advanced and developing economies.
4. The Impact on Currencies and Global Power
CBDCs are not just a financial tool; they are a geopolitical weapon. Whoever sets the CBDC standards could influence the future of global trade.
4.1 China’s First-Mover Advantage
China is far ahead with its Digital Yuan (e-CNY). Already tested in international trade pilots with countries like the UAE, Thailand, and Hong Kong, it may soon challenge the dollar in Asian and African trade corridors.
For China, the Digital Yuan is a way to reduce reliance on the U.S. dollar and avoid dollar-based sanctions. For partner countries, it offers an alternative payment system outside U.S. influence.
4.2 U.S. Response with a Digital Dollar
The U.S. has been cautious, but it cannot ignore the risk of losing dollar dominance. A Digital Dollar would aim to maintain its role as the global reserve currency. However, the U.S. faces political resistance due to privacy and state-control concerns.
4.3 Europe and the Digital Euro
The EU wants a Digital Euro to protect European trade sovereignty. This ensures European exporters aren’t overly dependent on U.S. systems like SWIFT or Asian payment networks.
4.4 Emerging Economies
Countries like India, Brazil, and Nigeria could use CBDCs to boost trade competitiveness. By settling trade directly in local digital currencies, they reduce forex risks and dependency on dollar reserves.
4.5 Multipolar Currency World
The long-term outcome may be a multipolar world of currencies, where trade is settled in multiple CBDCs rather than a single dominant reserve. This could reduce systemic risks but increase complexity.
5. Future Scenarios for World Trade with CBDCs
To imagine the future, let’s consider three possible scenarios:
5.1 Optimistic Scenario – Seamless Global CBDC Network
Countries agree on common standards for CBDCs.
Interoperability allows instant settlement between different CBDCs.
Costs drop, trade volumes soar, and SMEs globally benefit.
The dollar remains important but shares space with the Digital Yuan, Euro, and Rupee.
Transparency reduces fraud, boosting trust in trade.
This is the “global digital Bretton Woods 2.0” scenario — cooperation over competition.
5.2 Competitive Scenario – Currency Blocs and Rivalries
The U.S., China, and EU push their CBDCs, creating separate trade zones.
Global trade fragments, with Asia leaning on the Digital Yuan, the West on the Digital Dollar/Euro.
Smaller economies must choose sides, leading to geopolitical tensions.
Efficiency improves regionally but not globally.
This is the “Digital Cold War” scenario.
5.3 Risk Scenario – Fragmentation and Disruption
Lack of standardization makes cross-CBDC payments cumbersome.
Cyberattacks shake trust in CBDCs.
Dollar dominance weakens but no single CBDC replaces it, leading to volatility.
Trade costs rise instead of falling, hitting emerging economies hardest.
This is the “chaotic fragmentation” scenario.
6. Case Studies and Pilots
6.1 m-CBDC Bridge (China, UAE, Thailand, Hong Kong, BIS)
A real-world pilot enabling cross-border trade settlements via multiple CBDCs. Early results show faster, cheaper, and more secure payments compared to traditional banking.
6.2 India’s Digital Rupee
India has begun pilots of its retail and wholesale CBDCs. In the future, the Digital Rupee could play a huge role in South Asian trade, especially in energy and manufacturing supply chains.
6.3 Nigeria’s eNaira
Africa’s first CBDC, though adoption is slow. If scaled, it could support intra-African trade under the African Continental Free Trade Area (AfCFTA).
7. The Road Ahead – Key Requirements
For CBDCs to truly shape the future of trade, several things must happen:
Interoperability Standards: Just like SWIFT enabled global messaging, we need a global CBDC network.
Cybersecurity Frameworks: Robust protection against hacking and financial warfare.
Balancing Transparency and Privacy: Trade partners must trust that their data isn’t misused.
Global Governance: Institutions like the IMF, BIS, and WTO may play roles in setting rules.
Inclusive Access: Ensure developing nations aren’t left behind.
Conclusion
CBDCs represent the most significant innovation in money since the invention of paper currency. For world trade, they offer a future of speed, lower costs, transparency, and inclusion. However, they also pose risks of cyber insecurity, surveillance, and geopolitical fragmentation.
The future of trade with CBDCs will not be decided by technology alone but by political cooperation, global governance, and strategic choices made by the world’s leading economies.
If done right, CBDCs could usher in a new era of frictionless, fair, and inclusive trade, reducing reliance on the dollar and creating a multipolar currency world. If done poorly, they could create new divisions, power struggles, and systemic risks.
The choice before us is clear: Will CBDCs become a tool for global cooperation, or another weapon in the geopolitical rivalry? The answer will define the future of world trade in the 21st century.

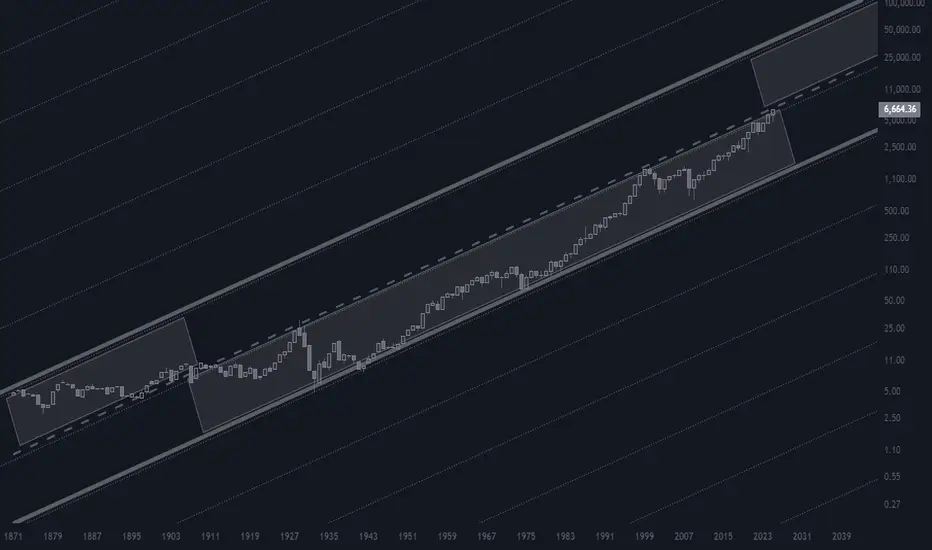
WARNING S&P 500, upper bound of bullish channel reached!Is the US stock market in a speculative bubble? Is the S&P 500 index and the S&P 500 futures contract approaching a major market top as the Fed’s new monetary trajectory has sustained the bullish move initiated last April?
This question is on investors’ minds as they ride the bullish trend in place for many months, and logically, one must be on the lookout for technical exhaustion signals to protect invested capital.
We will answer this question using technical analysis of financial markets with chartist and quantitative aspects.
1. Warning: the S&P 500 index and futures have reached the upper bound of their long-term bullish channel, but no bearish divergence yet
In technical analysis, several combined factors are needed to anticipate a major market top. The combination of a major technical resistance with a price/momentum bearish divergence is particularly effective.
The chart below shows the weekly candlesticks of the S&P 500 index: after rebounding in early April at the lower bound of its long-term bullish channel, the index has now reached the upper bound at 6700 points.
However, there is currently no price/momentum bearish divergence. Nevertheless, the strong technical resistance at 6700 could trigger profit-taking.
2. The Russell 2000 index, US small caps, has reached its all-time high from late 2021
In the short term, the Russell 2000 could also pause as it is testing its record high, but this resistance may be broken this autumn thanks to the Fed’s monetary pivot.
The chart below shows the weekly candlesticks of the Russell 2000 index.
3. From a quantitative perspective, S&P 500 stocks are not yet in an extreme overheating zone
Thus, 6700 points represent major resistance for the S&P 500, which could enter a short-term consolidation phase. However, the long-term bullish trend does not seem threatened, since the market is not in an extreme overheating zone from a quantitative perspective, as shown below by the percentage of S&P 500 stocks above the 50-day simple moving average.
DISCLAIMER:
This content is intended for individuals who are familiar with financial markets and instruments and is for information purposes only. The presented idea (including market commentary, market data and observations) is not a work product of any research department of Swissquote or its affiliates. This material is intended to highlight market action and does not constitute investment, legal or tax advice. If you are a retail investor or lack experience in trading complex financial products, it is advisable to seek professional advice from licensed advisor before making any financial decisions.
This content is not intended to manipulate the market or encourage any specific financial behavior.
Swissquote makes no representation or warranty as to the quality, completeness, accuracy, comprehensiveness or non-infringement of such content. The views expressed are those of the consultant and are provided for educational purposes only. Any information provided relating to a product or market should not be construed as recommending an investment strategy or transaction. Past performance is not a guarantee of future results.
Swissquote and its employees and representatives shall in no event be held liable for any damages or losses arising directly or indirectly from decisions made on the basis of this content.
The use of any third-party brands or trademarks is for information only and does not imply endorsement by Swissquote, or that the trademark owner has authorised Swissquote to promote its products or services.
Swissquote is the marketing brand for the activities of Swissquote Bank Ltd (Switzerland) regulated by FINMA, Swissquote Capital Markets Limited regulated by CySEC (Cyprus), Swissquote Bank Europe SA (Luxembourg) regulated by the CSSF, Swissquote Ltd (UK) regulated by the FCA, Swissquote Financial Services (Malta) Ltd regulated by the Malta Financial Services Authority, Swissquote MEA Ltd. (UAE) regulated by the Dubai Financial Services Authority, Swissquote Pte Ltd (Singapore) regulated by the Monetary Authority of Singapore, Swissquote Asia Limited (Hong Kong) licensed by the Hong Kong Securities and Futures Commission (SFC) and Swissquote South Africa (Pty) Ltd supervised by the FSCA.
Products and services of Swissquote are only intended for those permitted to receive them under local law.
All investments carry a degree of risk. The risk of loss in trading or holding financial instruments can be substantial. The value of financial instruments, including but not limited to stocks, bonds, cryptocurrencies, and other assets, can fluctuate both upwards and downwards. There is a significant risk of financial loss when buying, selling, holding, staking, or investing in these instruments. SQBE makes no recommendations regarding any specific investment, transaction, or the use of any particular investment strategy.
CFDs are complex instruments and come with a high risk of losing money rapidly due to leverage. The vast majority of retail client accounts suffer capital losses when trading in CFDs. You should consider whether you understand how CFDs work and whether you can afford to take the high risk of losing your money.
Digital Assets are unregulated in most countries and consumer protection rules may not apply. As highly volatile speculative investments, Digital Assets are not suitable for investors without a high-risk tolerance. Make sure you understand each Digital Asset before you trade.
Cryptocurrencies are not considered legal tender in some jurisdictions and are subject to regulatory uncertainties.
The use of Internet-based systems can involve high risks, including, but not limited to, fraud, cyber-attacks, network and communication failures, as well as identity theft and phishing attacks related to crypto-assets.

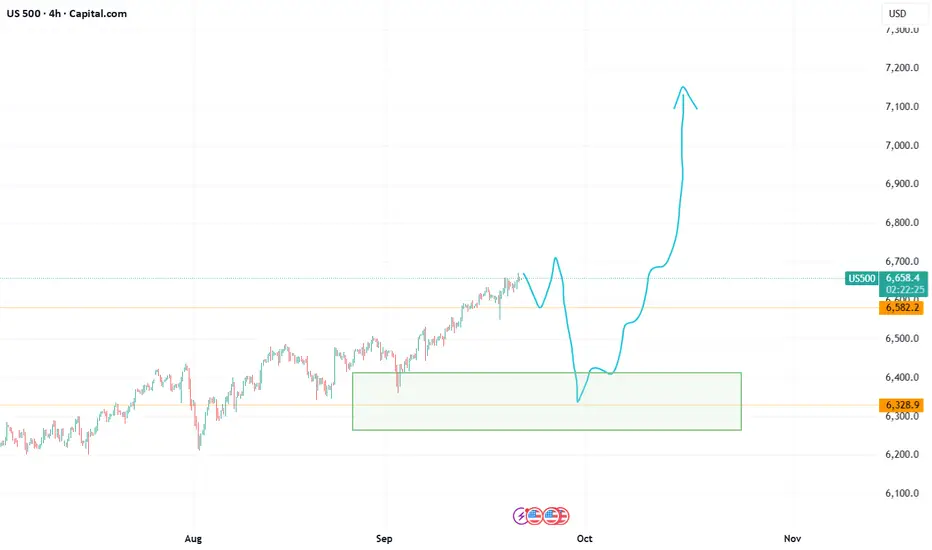
SPX reload zone, to ride the last parabolic wave into 2026SPX buy zone, after entering a bubble stage, idea based on fractals + market patterns
S&P 500 Index Shows Bearish DivergenceAlert #49
S&P 500 Index Shows Bearish Divergence
Since June, the price action has formed a negative signal. While the S&P 500 has moved up to make a new high, several key technical indicators have failed to confirm this new peak. This bearish divergence increases the risk of a significant correction.
Key Technical Levels and Outlook
Key Support to Watch: The critical support level is 6450.
Sell Signal: A technical sell signal will be triggered if the index drops and trades below its 50-day SMA.
Correction Timeline: Such a move could lead to a sustained correction that might last until early December.
Potential Bottom: We anticipate the bottom of this current downtrend cycle to occur around December 8th.

US500Success in forex and stocks comes from a combination of knowledge, discipline, and patience. Understanding market trends, economic factors, and company
fundamentals is crucial, but equally important is controlling emotions and sticking to a well-planned strategy. Continuous learning, adapting to changing conditions, and managing risk wisely can turn opportunities into consistent growth over time.
Consistency, not luck, separates successful traders from the rest.
S&P 500 Index (SPX) Weekly TF – 2025
Chart Context:
Tools Used: 3 Fibonacci Tools:
1. One **Fibonacci retracement** (from ATH to bottom)
2. Two **Trend-Based Fibonacci Extensions**
* Key Levels and Zones:
* **Support Zone** (Fib Confluence): \~4,820–5,100
* **Support Area (shallow pullback)**: \~5,500–5,600
* **Resistance & TP Zones:**
* TP1: **6,450** (Fib confluence & -61.8%)
* TP2: **6,840** (-27%)
* TP3: **7,450–7,760** (Major Confluence)
Technical Observations:
* SPX is approaching a **critical resistance** near previous ATH (\~6,128) with projected upward trajectory.
* The **green dashed path** suggests a rally continuation from current \~6,000 levels to TP1 (\~6,450), TP2 (\~6,840), and eventually TP3 (\~7,450–7,760), IF no major macro shock hits.
* The **purple dotted path** suggests a potential retracement first to \~5,600 (shallow correction) or deeper into \~5,120 or even 4,820 zone before continuing the bullish rally.
* The major support zone around **4,820–5,120** includes key Fib retracement levels (38.2% and 61.8%) from both extensions and historical breakout levels.
Fundamental Context:
* US economy shows **resilience** amid soft-landing narrative, though inflation remains sticky.
* The **Federal Reserve** is expected to cut rates in **Q3–Q4 2025**, boosting equity valuations.
* Liquidity expansion and dovish outlook support risk assets, including **equities and crypto**.
* However, **AI-driven tech rally** may be overstretched; a correction could follow earnings disappointments or macro surprises (e.g., jobs or CPI shocks).
Narrative Bias & Scenarios:
**Scenario 1 – Correction Before Rally (Purple Path)**
* If SPX faces macro pushback (e.g., high CPI, hawkish Fed), expect retracement to:
* 5,600 = Fib -23.6% zone
* 5,120–4,820 = Major Fib Confluence Zone
* These would act as **accumulation zones**, setting up next leg up toward TP1 and beyond.
* **Effect on Gold**: May rise temporarily due to risk-off move.
* **Effect on Crypto**: Could stall or correct, especially altcoins.
**Scenario 2 – Straight Rally (Green Path)**
* If Fed confirms cuts and macro remains soft:
* SPX breaks ATH (\~6,128)
* Hits TP1 (\~6,450), TP2 (\~6,840)
* Eventually reaches confluence at **TP3 (7,450–7,760)**
* **Effect on Gold**: May struggle; investor preference for equities.
* **Effect on Crypto**: Strong risk-on appetite, altseason continuation.
Indicators Used:
* 3 Fibonacci levels (retracement + 2 extensions)
* Trendlines (macro and local)
* Confluence mapping
Philosophical/Narrative Layer:
This phase of the market resembles a test of collective confidence. Equity markets nearing ATHs while monetary easing begins reflect a fragile optimism. The Fibonacci levels act as narrative checkpoints — psychological as much as mathematical. Will we rally on faith or fall for rebalancing?
Bias & Strategy Implication:
Bias: Bullish with caution
* Strategy:
* Await **confirmation breakout >6,128** for fresh long entries
* Accumulate on dips in the **5,100–5,500** zone if correction unfolds
* Use **TP1, TP2, TP3** as staged exits
Related Reference Charts:
* BTC.D Analysis – Bearish Bias:
* TOTAL:Bullish Bias
*TOTAL3 – Bullish Bias:
* US10Y Yield – Falling Bias Impact:https://www.tradingview.com/chart/US10Y/45w6qkWl-US10Y-10-Year-Treasury-Yield-Weekly-TF-2025/

Will SPX500 do the 7000 as the ultimate 3 monthly shows?Oct 2025 7222, if not then Jan 2026 7333, if not then April 2026 7481, etc?
s3.tradingview.com

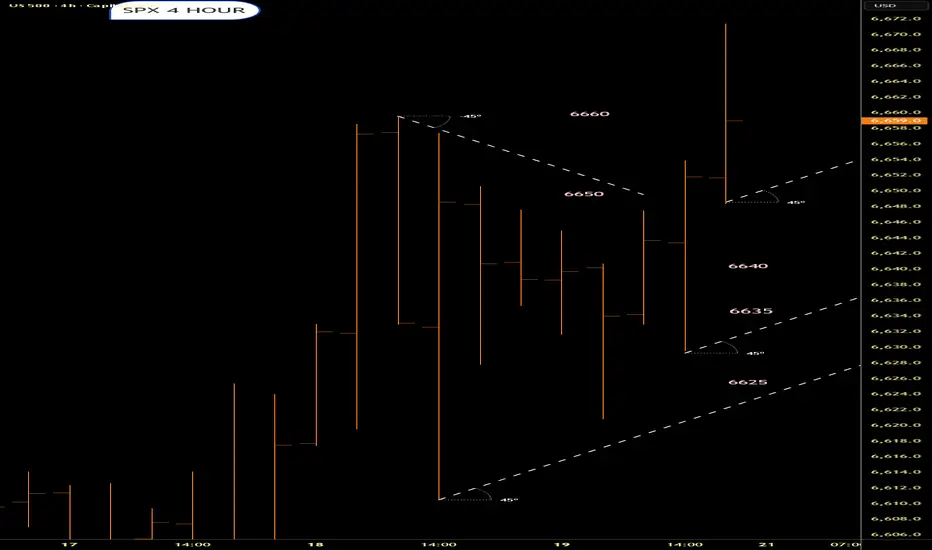
SPX despiked...Much clearerSpikes confusing the chart/ Bars and candlestick.Despiked looks alot cleaner

Stock market pullback aheadIt’s an incredible time for retail investors: the market is pumping non-stop, and it seems like it could continue indefinitely.
However, the charts are signaling a different scenario as we approach October.
MACD is at the top of its range
RSI is at the top of its range
Stochastic is at the top of its range
While liquidity remains high and rate cuts appear increasingly likely, history shows that when these indicators reach such extremes on the 1-week timeframe, a market correction often occurs. This reset can pave the way for further growth.
In short, we may see a correction, sideways movement, or a pause, most likely starting in October.
Anything is possible, but the charts don’t lie—even if sentiment can be misleading.
Monitor the situation closely: a market correction can also be a great opportunity to buy at lower prices.
DYOR.

SPX: rate cut fuels market rallyThe Fed finally made a long awaited move and cut interest rates by 25 basis points, for the first time during this year. Additional cuts are possible during the Q4, however, they will depend on the economic data, not on expectations from markets. Fed Chair Powell stressed that risks are now switched to the jobs market from the inflation, which moved relatively stable during the past period, although still modestly above the Fed's target of 2%.
The US equity markets continue to react positively to new macro developments, with S&P500 reaching another new all time highest level as of the end of the week at 6.665. The market also continues to move within a highly overbought range. Some analysts are beginning to stress that current S&P 500 levels are trading at 22 times forward earnings, noting that a period of consolidation would be a healthy period.
The rise in the S&P500 was helped by a sharp jump in Intel shares, which surged nearly 23% following Nvidia’s $5 billion investment and their plan to collaborate on AI-chips. Other top contributors included Nvidia, which recovered earlier losses despite concerns over Chinese tech regulations. Meanwhile, some S&P 500 stocks lagged: Darden Restaurants fell after disappointing earnings, and CrowdStrike saw gains after broker upgrades.

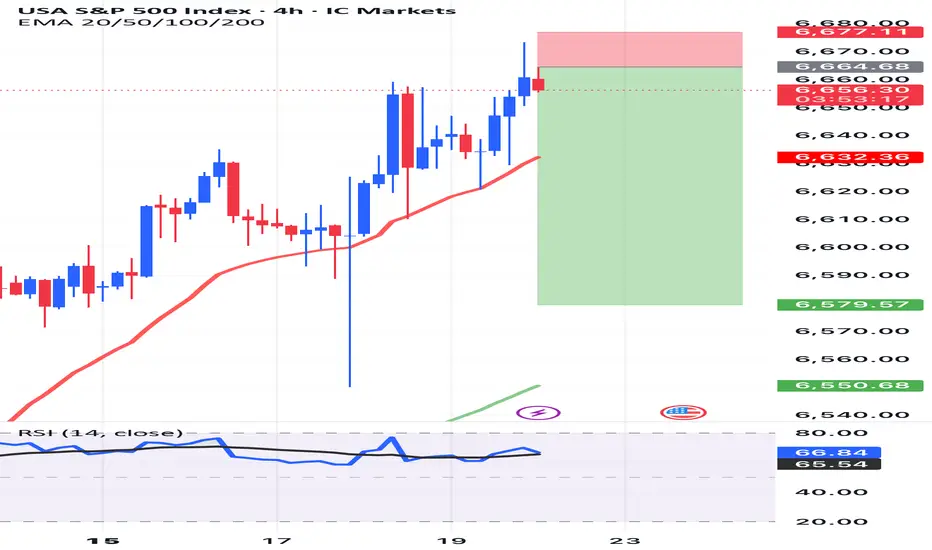
sp500 4hTrading Perspectives for the Upcoming Week
In this series of analyses, we have reviewed short-term trading perspectives and outlooks.
As can be seen, in each analysis there is a significant support/resistance zone near the current asset price. The market’s reaction to or break of this level will determine the future price trend up to the next specified levels.
Important Note: The purpose of these trading perspectives is to examine key price levels and the market’s potential reactions to them. The analyses provided are by no means trading signals!

The swan songCould be near the end, 7 years from completing Supercycle wave (V) and so Grand Supercycle wave .
Target for Grand Supercycle wave could be the territory of Supercycle wave (IV).

Inflation, Interest Rates & Global Trade CostsPart 1: Understanding Inflation
What is Inflation?
Inflation is simply the rate at which the general level of prices for goods and services rises over time. When inflation is high, money loses value—what you could buy last year for $100 may now cost $110.
Economists track inflation using indicators like the Consumer Price Index (CPI) or Wholesale Price Index (WPI). While some inflation is normal (a sign of healthy demand), too much or too little can destabilize economies.
Mild inflation (2–3% per year) usually means an economy is growing steadily.
High inflation (above 6–7%) erodes purchasing power, increases uncertainty, and hurts savings.
Hyperinflation (triple digits annually, like Zimbabwe or Venezuela at times) destroys entire economies.
Deflation (falling prices) may sound good, but it discourages spending and investment, leading to recessions.
Causes of Inflation
Demand-Pull Inflation – When demand for goods exceeds supply, prices go up. Example: During post-pandemic recovery, pent-up demand pushed prices higher globally.
Cost-Push Inflation – When production costs rise (raw materials, wages, fuel), producers pass costs to consumers. Example: Oil price spikes increase transportation and manufacturing costs worldwide.
Imported Inflation – When the cost of imported goods rises due to weaker currency or higher global prices.
Monetary Inflation – When central banks print too much money or keep interest rates artificially low, flooding the economy with liquidity.
Why Inflation Matters Globally
Inflation does not stay within borders. Higher energy prices in one country push up manufacturing costs worldwide. Food shortages in one region can cause global ripple effects. For example, the Russia-Ukraine war disrupted grain exports, leading to food inflation across Africa and Asia.
Part 2: Interest Rates
What are Interest Rates?
Interest rates represent the cost of borrowing money. Central banks (like the U.S. Federal Reserve, European Central Bank, or Reserve Bank of India) set benchmark rates that influence lending across the economy.
When central banks change rates, they are essentially trying to control inflation and economic growth.
Low interest rates encourage borrowing and spending but can fuel inflation.
High interest rates slow down borrowing, reduce spending, and cool inflation—but they also risk slowing growth too much.
The Inflation–Interest Rate Link
Central banks use interest rates as their main weapon against inflation. If prices are rising too fast, raising rates makes loans costlier, which reduces consumer demand and investment, eventually bringing inflation down.
For example, in 2022–23, the U.S. Federal Reserve aggressively hiked interest rates from near 0% to above 5% to fight the worst inflation in 40 years. That made mortgages, car loans, and corporate borrowing more expensive, slowing down demand.
Interest Rates & Global Trade
Interest rates do not just affect domestic economies—they also influence global trade and capital flows:
Currency Strength – Higher interest rates attract foreign investment, strengthening the domestic currency. A stronger dollar, for example, makes U.S. exports more expensive but imports cheaper.
Capital Flows – Investors chase higher yields. If U.S. rates rise, money flows into American bonds and stocks, draining liquidity from emerging markets.
Debt Burden – Many developing countries borrow in dollars. When U.S. rates rise, their repayment burden grows, sometimes leading to crises.
Part 3: Global Trade Costs
What are Trade Costs?
Global trade costs include everything that makes cross-border trade expensive or complicated:
Transportation Costs – Shipping freight, air cargo, fuel charges.
Tariffs & Trade Barriers – Import duties, customs delays, paperwork.
Supply Chain Costs – Warehousing, inventory, distribution networks.
Currency Fluctuations – Exchange rate risks add hidden costs to contracts.
Key Drivers of Trade Costs
Energy Prices – Oil and gas prices directly affect shipping costs. For example, a spike in crude oil prices can double container freight charges.
Geopolitical Tensions – Wars, sanctions, and tariffs increase uncertainty and add barriers to trade.
Infrastructure Bottlenecks – Port congestion, lack of modern rail/road links, or limited storage facilities make trade inefficient.
Technology & Automation – Digital tools (blockchain, AI logistics, tracking systems) can lower costs by reducing inefficiencies.
Regulatory Complexity – Each country’s rules on safety, quality, and documentation increase time and cost.
Recent Shocks to Global Trade Costs
COVID-19 Pandemic – Container shortages, factory shutdowns, and port delays caused shipping costs to multiply five-fold.
Russia–Ukraine War – Energy price shocks and rerouted shipping lanes raised logistics costs.
Climate Change & Canal Blockages – Events like the Suez Canal blockage (2021) disrupted $9 billion worth of daily trade.
Part 4: The Interconnection
Here’s where it all ties together:
Inflation & Trade Costs
Higher trade costs (fuel, shipping, tariffs) push prices up globally, fueling inflation.
Inflation in turn raises production costs, which feeds back into higher global trade prices.
Interest Rates & Inflation
Central banks raise rates to fight inflation.
But higher rates increase borrowing costs for shipping companies, exporters, and importers, raising global trade costs indirectly.
Interest Rates & Trade Costs
Higher rates strengthen currencies, making imports cheaper but exports less competitive.
Developing nations with heavy external debt see rising repayment burdens when rates go up, making global trade riskier.
A Cycle in Motion
Rising oil prices → higher shipping costs → global inflation.
Global inflation → central banks raise interest rates.
Higher interest rates → stronger currencies, weaker exports.
Weaker exports → trade slows down, but debt burdens grow.
This cycle shows how tightly linked these forces are, making global economic management extremely tricky.
Part 5: Case Studies
Case Study 1: U.S. Federal Reserve & Global Trade (2022–23)
When the Fed hiked rates rapidly to curb inflation, emerging markets like Turkey, Argentina, and India faced capital outflows and currency depreciation. Their import bills rose, worsening inflation. Shipping companies faced higher borrowing costs, raising freight charges.
Case Study 2: Oil Price Spike & Global Inflation (1970s & 2020s)
In the 1970s, OPEC’s oil embargo quadrupled oil prices, fueling global inflation and recession. In 2021–22, post-pandemic recovery plus the Russia-Ukraine war caused similar oil and gas price spikes, driving up both inflation and trade costs.
Case Study 3: Pandemic & Supply Chains
COVID-19 shutdowns raised container shipping costs from $2,000 per container in 2019 to nearly $20,000 in 2021. This directly drove inflation in consumer goods worldwide.
Part 6: The Future Outlook
Trends to Watch
De-Dollarization – If global trade shifts away from the U.S. dollar, interest rate cycles in the U.S. may have less influence globally, though this will take time.
Green Energy Transition – As shipping and manufacturing shift to renewable energy, volatility from oil price shocks may reduce, lowering trade costs in the long run.
Technology in Logistics – AI, blockchain, and real-time data tracking can significantly reduce global trade costs.
Fragmentation of Supply Chains – “Friendshoring” and regional trade blocs may reduce dependence on global shipping but increase localized inflation risks.
Climate Risks – Extreme weather, rising sea levels, and canal disruptions will continue to add volatility to trade costs.
Policy Challenges
Balancing Inflation & Growth – Central banks must avoid over-tightening, which risks recession.
Global Coordination – Inflation, interest rates, and trade costs are global phenomena; yet policies are mostly national. Lack of coordination worsens shocks.
Debt Sustainability – Rising global interest rates put developing nations at risk of debt crises, which can collapse trade flows.
Conclusion
Inflation, interest rates, and global trade costs are not isolated variables. They form a complex, interconnected system that shapes the global economy. Inflation eats away at purchasing power, central banks fight it with interest rates, and those rate changes ripple through currencies, trade, and debt. Meanwhile, trade costs—driven by energy, geopolitics, and supply chains—feed into inflation, creating a feedback loop.
For businesses, policymakers, and traders, understanding this triangle is essential. A shipping delay in Asia can fuel inflation in Europe. An interest rate hike in the U.S. can trigger capital flight from Africa. And an oil shock in the Middle East can raise costs across the globe.
In the 21st century, with economies so deeply interconnected, no country can ignore the dance between inflation, interest rates, and global trade costs. Managing this delicate balance will determine whether the world enjoys steady growth—or faces repeated cycles of crisis.

SPX 23% - 36% Market Crash From Recent Highs (~6,147)Structural Breakdown & Key Observations
Recent High: $6,147.43 (ATH level)
Bearish Momentum Indicators:
MACD: -40.98 (Bearish momentum increasing)
RSI: 45.11 (Weakening strength but not yet oversold)
Volume Increase: $14.18B → Indicates potential distribution.
Wyckoff Distribution Pattern Confirmation:
Potential Upthrust & Distribution Phase around 6,147 - 6,000.
If SPX loses 5,700 - 5,600, it will confirm a markdown phase → Bearish.
What Could Trigger a 23% - 36% Crash?
Macroeconomic Risks:
Rising interest rates (Liquidity tightening).
Earnings recession (Corporate profits declining).
Geopolitical risks (Oil, China, etc.).
Bond market stress → Inverted yield curve impact.
Technical Market Triggers:
Break of 5,600 → Strong Bearish Confirmation.
5,400 - 5,200 = Critical "Mid-Crash" Zone → If lost, crash risk accelerates.
VIX spikes above 30+ would confirm a volatility explosion.
✅ Bearish bias confirmed → If SPX breaks below 5,600, crash potential is HIGH.
✅ A 23-36% drawdown aligns with macro & technical risks.
✅ Watch for Fed intervention at ~4,300 - 4,750 levels → This will dictate if the market stabilizes.
🚨 Conclusion:
If SPX holds 5,600, expect a bounce → Otherwise, full markdown into a 23-36% crash is possible.
Key level to watch: 5,400 - 5,200 → This is the TRUE danger zone for a full market selloff.

Market cycle topI have reason to believe this cycle will continue until we tag ATH or the next fib 1.618 target which exceed the previous ATH. We now hit the 100% fib target so this could be one of the better buy the dip opportunities that we'll see for a long time.

YOU MAY LIVE TO SEE MANMADE HORRORS BEYOND YOUR COMPREHENSION :)"Beyond Technical Analysis" aka "Wave Analysis > Shingo Waves"
Some very notable calls in recent years:
SPREADEX:NIKKEI and TVC:DJI both to 40k (over 1y in advance)
CRYPTOCAP:BTC pico bottom at 15k and recent local top at 70k
FX:EURUSD pico bottom & TVC:DXY pico top at 115
TVC:USOIL pico bottom at 68
NASDAQ:SMCI mega breakout at 100
NASDAQ:NVDA mega support at 120
NASDAQ:TSLA pico bottom at 105
NASDAQ:NFLX pico bottom at 165
I've also absolutely NAILED _both_ OANDA:XAUUSD and OANDA:XAGUSD breakouts in their entirety (@ see history)
Major S&P 500 - Bearish Signals On 09/19/25 the S&P 500 (SPX) had two major bearish Signals.
Since March of 2000 all significant SPX peaks occurred with a rising VIX. On 09/19/25 the VIX made its second higher bottom since 08/28/25.
Daily RSI has reached the overbought zone and has a bearish divergence.
A multi – week decline could begin soon.

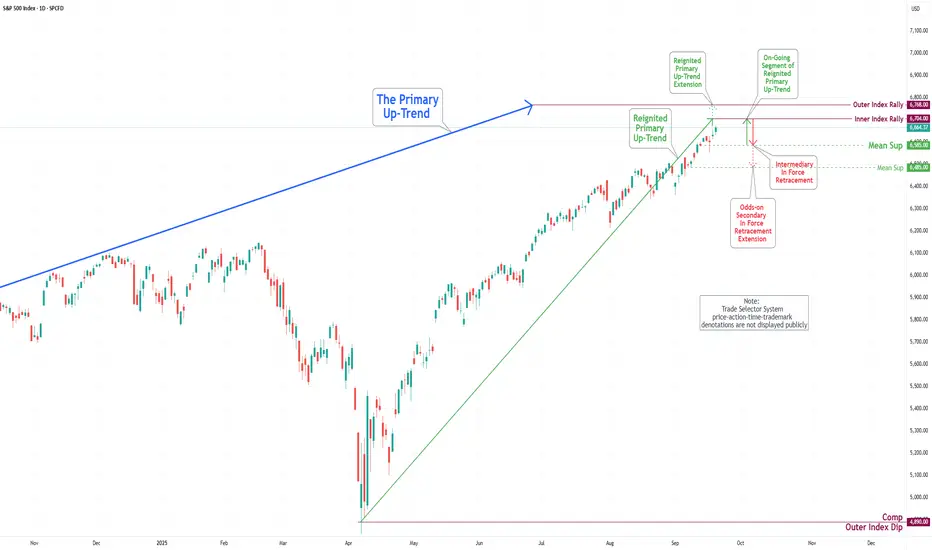
S&P 500 Daily Chart Analysis For Week of Sep 19, 2025Technical Analysis and Outlook:
In the trading session of the previous week, the S&P 500 Index demonstrated a significant upward price movement following a severe drawdown on Tuesday. The index successfully reached the Outer Index Rally level of 6620 and is currently progressing towards the established target of the Inner Index Rally at 6704, with the potential for further upward momentum to extend to the Outer Index Rally level of 6768.
It is essential to acknowledge that upon achieving the target of the Inner Index Rally at 6704, the expected price action is likely to initiate a substantial pullback, which is projected to aim for the target Mean Support level of 6585 and may extend to the Mean Support at 6485. Nonetheless, this primary segment of intermediary In Force Retracement pullback is likely to facilitate a considerable rebound, allowing for a subsequent retest of the Outer Index Rally level of 6704.
US500 (S&P500) Projection📊 US500 (S&P500) Forecast | Intraday & Swing Outlook 🚀📉
Asset Class: US500 CFD (SPX, SPY, S&P500)
Current Closing Price: 6,661.8 (20th Sept 2025, 12:50 AM UTC+4)
🔎 Market Overview
The S&P500 remains highly volatile as it consolidates near all-time highs. Both bullish continuation and reversal traps are emerging.
We integrate Elliott Wave 🌊, Ichimoku ☁️, Gann 🔺, and VWAP 📏 tools to frame trade setups.
⚡ Intraday Technical Levels
Immediate Support: 6,635 – 6,610 🟢
Key Resistance: 6,690 – 6,725 🔴
VWAP Zones: Anchored support at 6,628 📏
RSI: Neutral (52) → room to swing both sides 📈📉
🎯 Intraday Trade Ideas
Buy (Scalp): 6,620 – 6,635 🛒
Target: 6,670 → 6,690 🚀
Stop Loss: Below 6,600 ❌
Sell (Scalp): 6,690 – 6,710 🛑
Target: 6,645 → 6,625 📉
Stop Loss: Above 6,730 ❌
⏳ Swing Trading Outlook
Swing Support: 6,580 – 6,520 📉
Major Resistance: 6,750 – 6,820 🚀
Ichimoku Cloud: Bullish bias (daily/weekly) ☁️
Wave Count: Elliott suggests Wave 4 consolidation before Wave 5 breakout 🌊
🎯 Swing Trade Ideas
Buy (Swing): 6,580 – 6,600 🛒
Target: 6,720 → 6,800 🚀
Stop Loss: 6,520 ❌
Sell (Swing): 6,750 – 6,820 🛑
Target: 6,640 → 6,600 📉
Stop Loss: 6,860 ❌
📐 Pattern Watchlist
⚠️ Potential Bull Trap: Above 6,725 – rejection zone
⚠️ Head & Shoulders risk: Breakdown below 6,580
📏 Gann Levels: Time cycle indicates critical reversal window next week
☁️ Ichimoku Twist: Signals momentum shift by month-end
📌 Strategy Recap
🎯 Intraday Bias: Range trade → watch VWAP flips 📊
📈 Swing Bias: Bullish above 6,600, bearish below 6,580 🔑
⏳ Patience Key: Avoid chasing breakouts without volume confirmation 📉📊
🧭 Conclusion
The US500 (S&P500) is at a make-or-break zone.
✅ Buy dips near 6,600
❌ Sell rallies into 6,750 – 6,820
🔮 Expect volatility as macro events drive direction
📊 Stay disciplined, trade the levels, and adapt quickly 🚀📉
For individuals seeking to enhance their trading abilities based on the analyses provided, I recommend exploring the mentoring program offered by Shunya Trade. (Website: shunya dot trade)
I would appreciate your feedback on this analysis, as it will serve as a valuable resource for future endeavors.
Sincerely,
Shunya.Trade
Website: shunya dot trade
📝 TRADING CHECKLIST
Before entering any position:
- ✅ Confirm volume supports move
- ✅ Check RSI for divergences
- ✅ Verify multiple timeframe alignment
- ✅ Set stop loss before entry
- ✅ Calculate position size
- ✅ Review correlation with DXY/SPX/US30
- ✅ Check economic calendar
- ✅ Assess market sentiment
⚠️Disclaimer: This post is intended solely for educational purposes and does not constitute investment advice, financial advice, or trading recommendations. The views expressed herein are derived from technical analysis and are shared for informational purposes only. The stock market inherently carries risks, including the potential for capital loss. Therefore, readers are strongly advised to exercise prudent judgment before making any investment decisions. We assume no liability for any actions taken based on this content. For personalized guidance, it is recommended to consult a certified financial advisor.

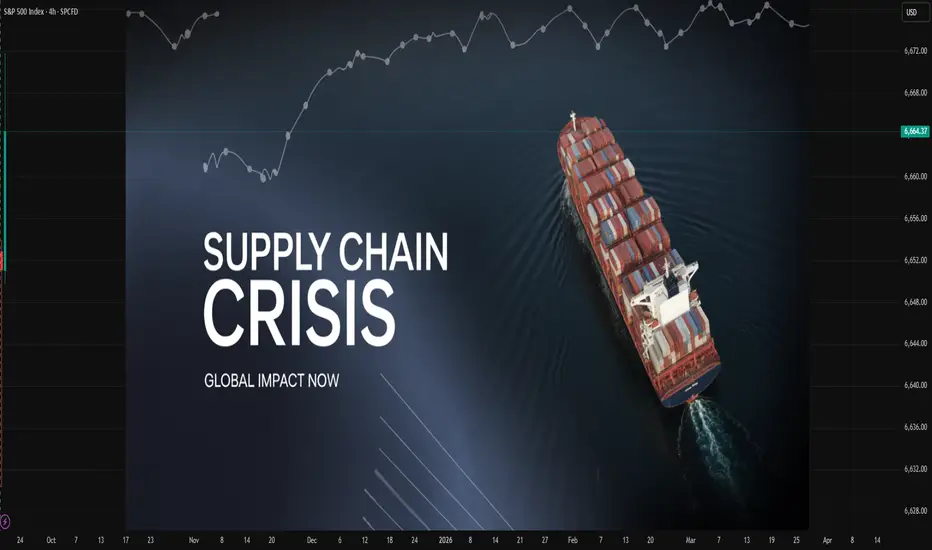
Sea Routes & Supply Chains1. The Historical Foundation of Sea Routes
1.1 Ancient Maritime Trade
Maritime trade is as old as civilization itself.
The Phoenicians of the Mediterranean (around 1500 BCE) mastered navigation and spread commerce across North Africa, the Middle East, and Southern Europe.
The Silk Road by sea connected China, India, Arabia, and Africa, long before modern globalization. Spices, silk, and precious stones moved across oceans, shaping cultures and economies.
In South Asia, the Indian Ocean trade system linked ports from East Africa to Southeast Asia. Seasonal monsoon winds powered dhows and junks carrying pepper, gold, and textiles.
1.2 Age of Exploration and Colonization
The 15th and 16th centuries marked a turning point. European powers—Portugal, Spain, the Netherlands, and later Britain—sought new sea routes to bypass land-based trade monopolies.
Vasco da Gama’s voyage to India (1498) opened Europe to Asian spices.
Columbus’s Atlantic crossing linked Europe with the Americas.
Britain’s mastery of naval power allowed it to dominate maritime routes, turning sea trade into imperial control.
Sea routes became instruments of wealth and power, laying the groundwork for today’s globalized supply chains.
2. Sea Routes: The Arteries of Modern Trade
2.1 Major Maritime Routes
Modern maritime trade relies on established routes shaped by geography and economics.
The Suez Canal Route: Connecting Europe and Asia via the Mediterranean and Red Sea. It shortens the Europe-Asia journey by nearly 7,000 km compared to circumnavigating Africa.
The Strait of Hormuz: A narrow chokepoint through which one-fifth of the world’s oil supply passes.
The Strait of Malacca: Linking the Indian and Pacific Oceans, this is one of the busiest shipping lanes in the world.
The Panama Canal: Vital for connecting the Atlantic and Pacific, especially for trade between the Americas and Asia.
The Trans-Pacific Route: Connecting East Asian manufacturing hubs (China, Japan, South Korea) with North American markets.
The Trans-Atlantic Route: Linking Europe and North America, critical for goods, energy, and raw materials.
2.2 Strategic Chokepoints
These routes rely on chokepoints, narrow maritime passages that, if disrupted, can cripple trade. The Strait of Hormuz, Malacca, and Bab el-Mandeb are classic examples. Piracy, blockades, or accidents in these areas can trigger global economic shockwaves—as seen when the Ever Given blocked the Suez Canal in 2021.
2.3 Cargo Diversity
Sea routes transport a staggering variety of goods:
Bulk commodities: oil, coal, iron ore, grains.
Containerized goods: electronics, apparel, machinery.
Liquefied gases: LNG and LPG.
Specialized cargo: cars, chemicals, refrigerated food (reefer containers).
The efficiency of sea routes lies in their ability to handle massive volumes cheaply compared to air or land transport.
3. Supply Chains: The Skeleton Behind Sea Routes
3.1 What Is a Supply Chain?
A supply chain is the entire process of sourcing, manufacturing, and delivering goods. It includes suppliers, factories, warehouses, transport hubs, shipping lines, and retailers. Sea routes act as international connectors within this chain.
3.2 Globalization and the Rise of Complex Supply Chains
From the late 20th century, businesses adopted “just-in-time” production to minimize inventory and reduce costs. Manufacturers sourced parts globally, relying on efficient shipping. For example:
A smartphone may have components from South Korea, semiconductors from Taiwan, assembly in China, and final sales in the U.S.
Automakers source steel from Brazil, engines from Germany, and wiring harnesses from Mexico.
Sea routes enable this complex web, making supply chains international in scope.
3.3 Containerization Revolution
The introduction of the shipping container in the 1950s revolutionized logistics. Standardized containers allowed goods to move seamlessly between ships, trains, and trucks. This reduced theft, increased efficiency, and lowered shipping costs dramatically. Today, mega-container ships can carry over 20,000 TEUs (Twenty-foot Equivalent Units), making sea transport the backbone of global supply chains.
4. Geopolitics of Sea Routes and Supply Chains
4.1 Naval Power and Trade Control
Sea routes are not just commercial pathways but also strategic assets. Countries with strong navies—like the U.S., China, and historically Britain—use maritime dominance to secure trade. Control over chokepoints gives nations leverage in global politics.
4.2 Belt and Road Initiative (BRI)
China’s Maritime Silk Road, part of the BRI, seeks to expand its influence by investing in ports and shipping infrastructure worldwide. From Gwadar in Pakistan to Piraeus in Greece, China is reshaping maritime geopolitics.
4.3 Trade Wars and Supply Chain Shifts
U.S.–China tensions have exposed vulnerabilities in supply chains. Companies are “China+1” strategies, diversifying manufacturing to Vietnam, India, or Mexico. Yet, all these shifts still depend on sea routes for global distribution.
4.4 Vulnerability to Conflict
Conflicts in Ukraine, the South China Sea, or the Middle East can disrupt supply chains. Sanctions and blockades weaponize trade routes, showing how economic security is intertwined with geopolitics.
5. Challenges Facing Sea Routes and Supply Chains
5.1 Disruptions
Pandemics: COVID-19 exposed supply chain fragility when ports shut down, containers piled up, and shipping costs soared.
Piracy: Particularly in the Gulf of Aden and parts of Southeast Asia.
Climate Change: Rising sea levels, stronger storms, and melting Arctic ice are reshaping routes.
5.2 Environmental Concerns
Shipping contributes about 3% of global CO₂ emissions. Heavy fuel oil pollutes air and oceans, prompting stricter environmental regulations. The push for green shipping—using LNG, hydrogen, or wind-assisted propulsion—is gaining momentum.
5.3 Infrastructure Strain
Mega-ships require deeper ports and better logistics hubs. Not all regions can afford the infrastructure, creating bottlenecks in global trade.
6. The Future of Sea Routes and Supply Chains
6.1 Technological Transformation
Digitalization: Blockchain and AI are streamlining documentation and tracking shipments.
Autonomous Ships: Trials are underway for crewless vessels that reduce costs and risks.
Smart Ports: Automated cranes and AI-driven logistics increase efficiency.
6.2 Arctic Sea Routes
As ice melts, the Northern Sea Route along Russia and the Northwest Passage through Canada are becoming viable. These routes cut travel time between Asia and Europe but raise environmental and sovereignty concerns.
6.3 Regionalization vs. Globalization
Some argue the world is moving towards regional supply chains due to geopolitical tensions and resilience concerns. For instance, the EU encourages near-shoring manufacturing, while the U.S. promotes domestic chip production. However, sea routes will remain indispensable for intercontinental trade.
6.4 Resilient Supply Chains
Companies are rethinking strategies:
Building redundancy (multiple suppliers).
Increasing stockpiles of critical goods (semiconductors, medicines).
Investing in predictive analytics for disruptions.
Conclusion
Sea routes and supply chains truly are the hidden arteries of the global economy. From the spice traders of antiquity to the container ships of today, oceans have been the lifeblood of commerce and civilization. They connect continents, fuel industries, and ensure the smooth functioning of daily life. Yet, they remain vulnerable to geopolitical rivalries, environmental pressures, and technological disruptions.
As the world faces climate change, rising protectionism, and shifting power balances, the future of sea routes and supply chains will demand innovation, resilience, and cooperation. They may be invisible to the average consumer, but every time someone picks up a smartphone, drinks coffee, or fills their car with fuel, they are directly benefiting from the silent yet powerful arteries that keep the global economy alive.