Bull Run Stumbles: S&P 500 Heads Toward a Potential Correction After a rough day on Wall Street, the S&P 500 dropped about 1.2%, pulling U.S. markets lower. But there’s more behind this fall than just profit-taking.
What’s Really Happening?
Warning Signs from Wall Street
Two top banking leaders raised caution. Morgan Stanley’s Ted Pick expects a 10–15% correction, calling it a “healthy normalization.”
Goldman Sachs’ David Solomon warned that tech stocks are showing bubble-like behavior, with prices running much faster than earnings.
AI Boom Driving Market Concentration
The AI craze and tech optimism have made a few mega-cap companies dominate the market. In fact, just 10 big tech firms now make up nearly 40% of the S&P 500’s total value, making the market more fragile.
Fed Confusion Adds to Uncertainty
The Federal Reserve is sending mixed signals — some officials talk about possible rate cuts by December, while others say rates should stay high because the economy is still strong.
Adding to the mess, a partial U.S. government shutdown has delayed key data, leaving investors and the Fed guessing about what’s really happening in the economy.
What the Chart Reveals
From a technical standpoint, the U.S. market’s rally has been nothing short of extraordinary. Since the April bottom near 4,835, the index has soared nearly 42%, touching a recent peak around 6,920 — and even gained about 12–13% before the latest (April 2025) pullback began.
But now, the momentum seems to be fading. The chart is flashing early warning signals — RSI divergence suggests that while prices made new highs, the underlying strength (momentum) did not. That often hints at a potential trend reversal.
If this weakness deepens, the index could correct swiftly by around 10%, targeting the 6,200–6,100 zone. And if the “healthy normalization” predicted by Morgan Stanley’s Ted Pick (a 15% drop) plays out, the index might slide further to around 5,700 — a level that would reset valuations to more reasonable territory after the sharp run-up.
Valuation Check
Let’s set aside all the opinions and headlines for a moment and focus on the key valuation metrics that truly help us understand the real picture of the U.S. market.
The Price-to-Earnings (P/E) Ratio — The Market’s Mood Meter
P/E Ratio = Current Market Price/Earnings Per Share (EPS)
So, Current Market Price = P/E Ratio*EPS
Currently, the S&P 500’s P/E ratio stands at 30.8x, with an EPS of $222.5.
When you multiply the two — 30.8 × 222.5 = roughly $6,800 — it perfectly aligns with the index’s recent market level.
Now, to find out what the fair value of the market should be, let’s use the 5-year median P/E ratio, which is around 25.4x.
Fair Market Price = 25.4*222.5 = 6,650.
This aligns perfectly with the technical chart levels, suggesting that a 15% correction would be a healthy pullback to help cool down the overheated U.S. market.
The Buffett Indicator — Market Cap vs. GDP
One of Warren Buffett’s favorite valuation tools compares the total U.S. stock market capitalization to the country’s GDP — essentially measuring how large the market has grown relative to the real economy.
At present, this ratio stands at around 224%, far above the long-term fair value range of 100–120%. Even when compared to its 5-year median level of 192%, the market still appears significantly overvalued.
To return to its median level, the ratio would need to drop by roughly:
100 = 16.6%
That’s roughly a 15–16% correction, which again perfectly aligns with both the technical chart signals and Ted Pick’s projection of a healthy market normalization.
The Bottom Line
The U.S. market’s extraordinary rally has been built on a mix of AI optimism, liquidity hopes, and investor euphoria, but the fundamentals are starting to whisper caution.
Both valuation metrics and technical signals point to the same conclusion — the market is stretched, and a 10–15% correction wouldn’t be a disaster; it would be a return to balance.
History shows that every overheated bull run needs a pause — not to end the story, but to give it a stronger foundation.
So if the coming months bring some red on the screen, smart investors will see it not as fear, but as the market taking a deep breath before its next big move.
Trade ideas

More upside for SPX500USDHi traders,
Last week SPX500USD went up and made a correction down.
So next week we could see more upside for this pair.
Let's see what the market does and react.
Trade idea: Wait for the correction down to finish. After that look for an impulse wave with a correction down on a lower timeframe. After a change in orderflow to bullish you could trade longs.
This shared post is only my point of view on what could be the next move in this pair based on my technical analysis.
But I react and trade on what I see in the chart, not what I've predicted or expect.
Don't be emotional, just trade your plan!
Eduwave

Change in the analysisWith no bounce to speak of and now the vix comfortably over 20, the chances are good we are in the middle of a C wave to 6500 and possibly lower.

SPX500 – Bullish Momentum Holds Above 6812 | Eyeing 6877 NextSPX500 – MARKET OVERVIEW | Bullish Bias Above 6812
The SPX500 index continues to show bullish momentum, holding firm above the pivot zone (6812–6797).
As long as price action remains above 6812, upside movement is expected toward 6842 and 6877, with a potential extension toward 6915 if bullish sentiment strengthens.
However, a sustained move below 6796 would weaken the current trend and open the way for a short-term bearish correction toward 6769 and 6754.
Key Technical Levels
Pivot Zone: 6812 – 6797
Resistance: 6842 · 6877 · 6915
Support: 6769 · 6735 · 6705
Outlook:
SPX500 remains bullish while above 6812, but a close below 6796 could trigger a corrective decline toward 6769–6754.

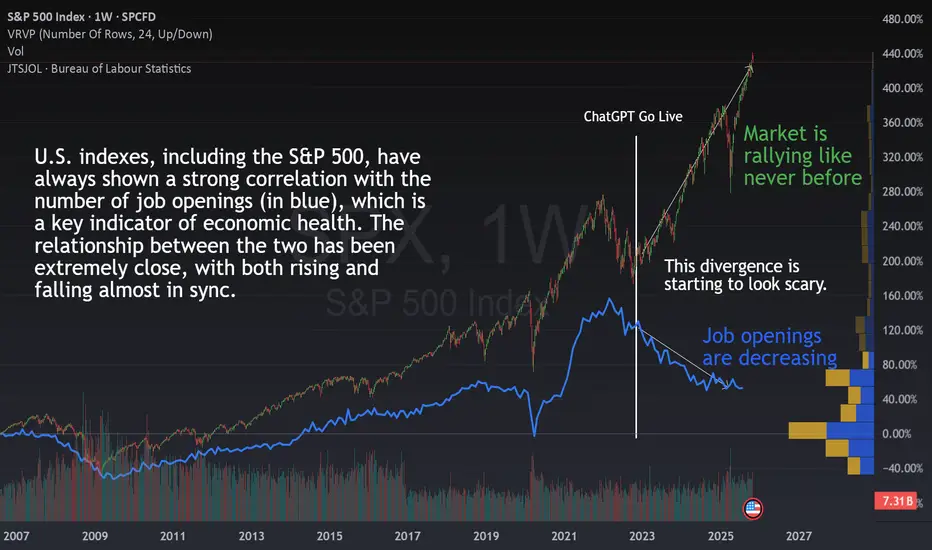
The Scariest Divergence In the MarketThe Scariest Divergence In the Market
If you look at the chart, you’ll see the TVC:SPX (candles) and U.S. job openings (in blue) plotted together since 2001.
Historically, these two metrics have been highly correlated , both rising and falling almost in sync as the economy expanded or contracted.
But something changed dramatically in November 2022.
That’s when ChatGPT went live, marking the start of the AI boom that has reshaped entire industries and mindsets. From that point on, we can see a massive divergence, the kind we’ve never seen before.
While job openings have kept declining steadily, the market has rallied like never before. This is not logical from a historical point of view.
🤖 Is AI Replacing Workers?
One possible explanation is that the market sees AI as a reason for optimism:
“If companies can do more with less labor, that means higher margins and better efficiency.”
So, fewer job openings might not scare investors anymore, it could even be seen as a sign of progress.
But that raises two key questions:
Is AI really replacing workers ?
If so, what happens to the broader economy and ?
📊 What the Data Says So Far
Surprisingly, unemployment in the U.S. has increased only slightly since AI went mainstream.
It’s a slow, healthy rise not a surge. So i t doesn’t seem like AI is replacing workers at scale just yet.
That’s good news in one sense, if unemployment remains low, consumer demand stays healthy, and the economy keeps running.
However, it also means that companies’ fixed costs haven’t really improved, and their productivity gains from AI are still very moderate , far from the exponential growth that the market seems to be pricing in.
💡 My current View
From my perspective, this chart makes one thing very clear.
The benefits of AI , as of today, are still much smaller than what the market is assuming.
Yes, AI will improve margins and efficiency over time. But if everyone implements it, competition will eventually push prices down again, and margins with them. The very same than internet with the online sales.
The real challenge won’t be for companies that adopt AI, but for those that don’t adapt fast enough , or for those that overspend on AI tools that fail to deliver meaningful returns.
☄️Some AI Stocks Are Starting to Show Doubt
Several major AI-related stocks are also showing concerning patterns . We don’t have confirmation yet , but it’s time to stay alert and be prepared in case the market starts breaking key support levels among the main players.
And the main index, S&P 500 is still in the bull zone but are key levels to watch closely:
🤔 What Do You Think?
Is AI truly transforming company performance as fast as investors believe?
Or are we witnessing a global over-excitement where expectations are running far ahead of reality?
SPX: Pulls back from the latest ATHThe Fed cut interest rates by 25 basis points, as widely expected, while US equity markets pulled back from recent all time highest levels. This could be a short summary of the previous week on the US markets. The higher volatility continued leading the sentiment toward the overbought side. The newest ATH for the S&P 500 was at 6.917, but the index is closing the week at 6.840. The market was not happy regarding Fed Chair Powell comments that the rate cut in December is not guaranteed. The US Government continues to be in a state of a “shutdown”, where the majority of important macro data are still not available to the public, so the investors are currently acting in a sort of "blindfolded" manner when it comes to macro data.
The S&P 500 slipped as two of its largest members, Meta Platforms and Microsoft, weighed on the market. Meta plunged about 12 % after forecasting significantly higher AI-capex next year, while Microsoft declined over 2 % following disclosure of nearly $35 billion in planned spending. Meanwhile, Alphabet bucked the trend with a gain of 5.5 % thanks to strong advertising and cloud revenue offering some bright spots amid tech weakness. Amazon surged around 9,6% after a strong quarter led by cloud growth. Tesla was also a weekly winner with around 3,7% gain.
Analysts are in agreement that higher volatility of the equity market could continue in the future period. Tech companies are currently strongly investing into AI adoption, with some estimates of $600 billion in capital spending already planned for the next year. This will be one of indicators that investors will be closely watching in the future, especially examining how this CAPEX spending is translating into rising AI-driven revenues for each company.

SP500The S&P 500 has been in a strong uptrend since 2023 continuing its long-term bull run.
Currently the index is testing a critical resistance zone near the top trendline and the Fibonacci 1.618 extension (6800 – 7000) an area where rallies often pause or correct.
This makes it a decisive moment for the market: a confirmed breakout above this level could signal further upside while a rejection may trigger a healthy correction before the next move higher.

S&P 500: Multiple Bearish Signals AlignS&P 500 index chart shows multiple bearish signals on the weekly time frame
1. The price has hit the upside of the long-term uptrend and it was rejected
2. Bearish Reversal Evening Star Candlestick pattern appeared on the top
3. RSI has built the Bearish Divergence as it did not confirm the new peak
There are 3 support levels:
1. Double support of trend channel's mid-line and previous top around $6,147
2. Bottom of the channel between $5,300 and $5,400
3. "Die-hard" multiple support that was built since 2021 around $4,819
What are your thoughts?

Markets Looking SOFT at highs - Correction Underway (Key Levels)October 10th candle is a very important low for all US Markets
-S&P
-Nasdaq
-Dow
-Russell
The rally from that Oct 10 candle low (Friday) was met with aggressive
support but was only showing rallies in Mag 7 and AI related plays
Earnings for the most part are coming in meeting or exceeding expectations, but
price action is certainly looking soft with the market making lower highs and lower
lows for now
We have plenty of technical support, but given the longest US Government Shutdown
in history with dot.com like valuations (there is bubble and non-bubble evidence),
sentiment and elevated volatility are taking their toll and dragging the markets lower
I've closed a lot of open positions and de-risked the portfolio pretty severely this week
with the intention of finding ways to participate in a cautiously bullish environment. As I mention in the video, markets tend to V bottom, but round out the tops so the longer we
stall at these highs and the more "rounded" look we have near these highs, the more
fragile and support can be if we eventually see a break lower - TBD
Day to day, we continue to do good work carving out short-term winners and properly
position for what is next - good or bad
Thanks for watching. See you in the live markets
-Chris

SPX500 | Futures Steady Near Highs, Key Level 6,877 in FocusSPX500 – MARKET OUTLOOK | Futures Edge Higher as Earnings Season Heats Up 🇺🇸
U.S. stock futures inched higher on the first trading day of the month, as traders focus on a busy week of earnings across major sectors.
🔽 Below 6,877: Bearish momentum toward 6,842 → 6,800 → 6,770.
🔼 Above 6,888: Bullish reversal toward 6,918 → 6,941.
Pivot: 6,877
Support: 6,843 · 6,800 · 6,770
Resistance: 6,918 · 6,941
SPX500 remains bearish while below 6,877, though earnings results could trigger short-term volatility or a potential breakout.

SPX500 – Bearish Momentum Active | Eyes on 6670 SupportSPX500 | Overview
Wall Street futures struggled for traction on Friday, wrapping up a volatile week marked by concerns over the U.S. economic outlook and stretched tech-sector valuations.
After a sharp 1.5% decline yesterday, the index continues to trade under bearish pressure, with potential for a retest before the next move.
Technically:
The price remains volatile, with a retest toward 6754 still possible.
As long as the price stays below 6754, downside momentum could continue toward 6706 and 6670.
A confirmed 1H close below 6706 would strengthen bearish pressure, targeting 6670 → 6626 → 6580.
However, if the price stabilizes above 6754, short-term bullish momentum may return, targeting 6775 and 6814.
Pivot Zone: 6723 – 6706
Resistance: 6754 · 6775 · 6814
Support: 6670 · 6626 · 6580
Outlook:
SPX500 remains bearish while below 6754, with risk of continued correction toward 6670–6626.
Only a 1H close above 6754 would signal recovery toward 6775–6814.

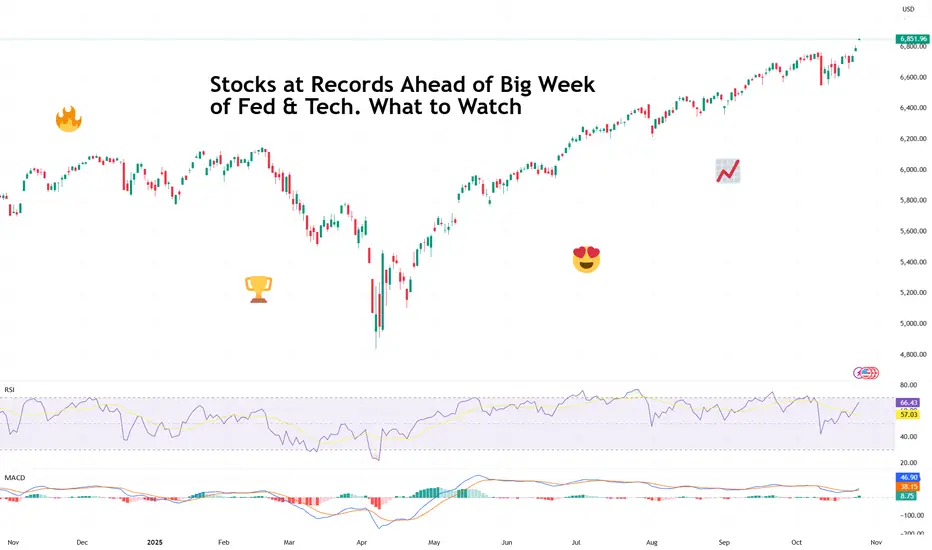
Stocks at Records Ahead of Big Week of Fed & Tech. What to WatchRecord highs, rate-cut optimism, five tech giants on deck — what a time to be a market participant!
It’s Monday, and Wall Street is back doing what it does best — setting new records and pretending not to worry about what comes next.
After a cooler-than-expected inflation print and some diplomatic smiles from Washington and Beijing, all three major indexes are kicking off the week in full throttle.
Last Friday, the Dow Jones Industrial Average TVC:DJI finally closed north of 47,000 for the first time ever, rising 472 points, or 1%.
You know that feeling when you hit every green light on the way to work? That’s what Friday felt like. The S&P 500 SP:SPX climbed 0.8%, and the Nasdaq Composite NASDAQ:IXIC gained 1.2%. Together, the trio ended the week at record highs.
The spark? September’s Consumer Price Index ECONOMICS:USCPI rose 3.0%, slightly below the 3.1% expected. Traders took that as a nod from the economy that the Federal Reserve can keep easing off the monetary brakes.
Odds of at least a half-point in rate cuts by year-end jumped to nearly 97%, according to the CME FedWatch Tool.
Soft inflation, strong sentiment, and new highs — *insert feelsgoodman meme.*
🤝 A Trade Truce (For Now)
Adding to optimism, US and Chinese negotiators sounded unusually positive over the weekend. The two sides reportedly hammered out a trade framework, setting the stage for President Donald Trump and Chinese leader Xi Jinping to meet in South Korea later this week.
Treasury Secretary Scott Bessent said the talks “ought to pave the way” for a broader discussion on tariffs, tech transfers, and everything in between — the kind of vague optimism that markets eat up like comfort food.
For now, investors are choosing to focus on the handshake rather than the fine print. After all, in the markets, hope is often more powerful than details.
🏦 The Fed’s Big Moment
The main event, however, comes midweek. The Federal Reserve is widely expected to cut interest rates ECONOMICS:USINTR by a quarter point on Wednesday. But the real show starts after the decision, when Jerome Powell takes the mic.
Traders will be parsing every word of his press conference for hints on how much further the Fed is willing to go. The tone of his remarks could determine whether markets keep coasting at record highs — or finally take a breather.
So far, Powell has managed to thread the needle: easing just enough to keep growth alive without letting inflation flare back up. But with stocks at all-time highs and job data still missing due to the government shutdown, he’s got a tough balancing act.
💻 Big Tech Takes the Stage
Anyway, peak earnings season is here and if macro policy is the first act this week, Big Tech earnings are the broader narrative.
Five members of the Magnificent Seven — Microsoft NASDAQ:MSFT , Alphabet NASDAQ:GOOGL , Meta NASDAQ:META , Apple NASDAQ:AAPL , and Amazon NASDAQ:AMZN — will all report their latest results.
That’s roughly $12 trillion in combined market cap stepping into the spotlight.
After a few solid years of sky-high expectations around AI, cloud, and advertising recovery, investors are craving proof that the hype is translating into actual earnings.
The question isn’t whether these companies are still dominant — it’s whether they can keep growing fast enough to justify valuations that have already priced in perfection.
Microsoft, Meta and Alphabet kick things off Wednesday, Apple and Amazon step up Thursday. Somewhere between all that, expect social media feeds to explode with charts, hot takes, and the occasional meme about “buying the dip” before it even happens.
🌍 Markets in a Mood
It’s one of those rare weeks when every major force — central banks, geopolitics, and tech earnings — converge into a single market narrative. And, by the looks of it, that narrative is leaning bullish.
Still, keep an eye out for surprises.
Off to you : Where do you think markets are heading this week? Are you excited to snap up some tech shares ahead of the updates or looking to play defense? Share your thoughts in the comments!
Nov 6 - a move down is likely, but not certainOn SPX we're at double resistance. If we sell off here, we could have another C down, in which case, another bear trap may form (see chart at end of video). The market is very choppy and probably will continue to be for some time. Gold looks like it will test it's lows. BTC looks like it may test it's lows. Oil is still holding the 18ma, but it's running out of time to do something else.

SPX500 - Biggest Weekly Loss as AI Valuations Face ScrutinySPX500 – MARKET OUTLOOK | Biggest Weekly Loss as AI Valuations Face Scrutiny 🇺🇸
The S&P 500 posted its largest weekly loss in weeks as investors questioned high AI stock valuations and shifted toward safer assets.
The index remains under bearish pressure while trading below 6,770, with momentum favoring further downside.
🔽 Below 6,770: Bearish continuation toward 6,705 → 6,670 → 6,610.
🔼 Above 6,782: Bullish correction toward 6,814 → 6,842.
Pivot Zone: 6,755–6,765
Support: 6,705 · 6,670 · 6,610
Resistance: 6,798 · 6,814 · 6,842
SPX500 remains bearish while below 6,770, but a confirmed 1H close above 6,782 could trigger a short-term recovery toward 6,814–6,842.

SPX - clear bullish signs ahead..SPX Has recently tested major support levels but struggled to break through below and bounced back up to the upside. The price also broke through the resistance trendline to the upside which is a major clear sign that SPX will be hitting the next upward target (fibonacci extension) shown on the chart

US 500 - Has All the Good News Been Priced?Concerns about excessive stock market valuations, especially when talking about AI focused companies, isn’t something new. In fact, it has been an on-going theme over the last 6 months of the year leading to bouts of risk aversion.
This was again the case late on Monday evening, and throughout the day yesterday when the earnings of Palantir Technologies were in the spotlight. The strange thing was that the earnings from this company, released after the close on Monday, beat analysts’ expectations, however a lack of clarity on future revenue needed to justify a market capitalisation of over $600 billion was what brought the latest concerns of an AI bubble back to the attention of traders, leading to a negative sentiment shift for the wider sector and the US 500 index in general.
Now, this may or may not be the start of a wider correction and much will depend on future risk events, price action and technical trends (more on this below), however the question for traders this time around is whether the positive news flow for US indices in the short term has already been priced? After all the US 500 index only hit a new record of 6925 on October 30th, 5 days ago.
November and December are historically strong performance months for the US 500, however currently traders are faced with several issues to navigate. Only a week ago the Federal Reserve cast some doubt over whether a rate cut in December would happen or not, with policymakers maintaining this stance in their comments at various events since then. This wasn’t expected and has led to some disappointment for traders which weighed on US 500 sentiment.
Q3 earnings have generally beaten expectations but then valuations were already high to reflect this, leading to some potential fatigue. Trade tensions between the US-China have cooled, but concerns still remain about economic growth in both countries, especially in the US, where a US government shutdown has led to the delay of key data releases such as CPI, retail sales and the all-important Non-farm Payrolls update on the current health of the US labour market, a key factor influencing the decision making of the Fed on potential interest rate cuts.
This means the release of today’s US ADP Private Payrolls data at 1315 GMT and the US ISM Services PMI survey at 1500 GMT could have a bigger influence over the direction of the US 500 moving across the week.
Technical levels and trends may also become increasingly important.
Technical Update: Back to Fibonacci Retracement Support
After reaching a new all-time high of 6925 on October 30th, the US 500 index has corrected by 2.9%, easing short-term overextended upside conditions. This pullback may reflect a healthy pause within a broader uptrend, but the question now appears to be whether this marks the extent of corrective downside moves or is the beginning of a phase of further price weakness.
As the chart below shows, latest declines in the US 500 index have now returned to a potential support zone at 6750/6760, marking the 38.2% Fibonacci retracement of the October 10th to 30th rally and the current level of the Bollinger mid-average. This possible support band may limit current declines, but closing behaviour around this area could be important in determining whether buyers can regain the upper hand or if deeper corrective risks can emerge.
Traders could now be watching this 6750/6760 support closely, as closing break below might see increased downside pressure. Such moves could then mean focus shifts to 6711, even 6661, marking the deeper 50% and 61.8% Fibonacci retracement levels.
That said, while the support is currently under pressure, the 6750/6760 range still holds on a closing basis and may help limit further selling pressure, even possibly see renewed attempts at price upside. However, traders may also now be monitoring 6825, equal to half the recent price decline, as a resistance level in the sessions ahead.
If momentum is to shift back toward attempts to renew price strength, a closing break above 6825 may be required to suggest scope to retest the 6925 October 30th all-time high.
The material provided here has not been prepared accordance with legal requirements designed to promote the independence of investment research and as such is considered to be a marketing communication. Whilst it is not subject to any prohibition on dealing ahead of the dissemination of investment research, we will not seek to take any advantage before providing it to our clients.
Pepperstone doesn’t represent that the material provided here is accurate, current or complete, and therefore shouldn’t be relied upon as such. The information, whether from a third party or not, isn’t to be considered as a recommendation; or an offer to buy or sell; or the solicitation of an offer to buy or sell any security, financial product or instrument; or to participate in any particular trading strategy. It does not take into account readers’ financial situation or investment objectives. We advise any readers of this content to seek their own advice. Without the approval of Pepperstone, reproduction or redistribution of this information isn’t permitted.

SPX: Bullish Exhaustion Signals a Short-Term PullbackThe TVC:SPX is currently showing signs of a potential short-term retracement after rejecting the 6,860–6,880 supply zone. The recent upswing into this zone lacked strong bullish momentum, suggesting that buyers are losing control. If price maintains below this resistance area, it could indicate the continuation of the short-term bearish structure.
The red zone marks a clear supply area where previous bullish attempts were absorbed, while the green zone below highlights a demand area between 6,740–6,770 — a potential target for sellers. A clean break below the recent intraday low would likely accelerate bearish momentum toward that zone.
Traders may look for confirmation from lower timeframes before shorting, as the broader structure still remains within a corrective phase after the prior rally.

S&P 500: Overheated Valuation vs. SeasonalityAs the S&P 500 posts a Shiller CAPE ratio of 40.24 in early November 2025 — nearly equivalent to the dot-com bubble peak in 2000 (~44) — a key question arises: can the U.S. market still advance during the last two months of the year? History suggests that November and December seasonality often favors bulls, yet economic reality and valuation levels may temper this optimism.
Valuations on the Verge of Overheating
Fundamental indicators speak for themselves. A Shiller P/E around 40 signals extreme overvaluation; the historical average is around 17. The Buffett Indicator, which compares total market capitalization to GDP, exceeds 200% — an all-time high, well above levels seen before the 2000 and 2007 crises. In other words, U.S. equity prices are today largely disconnected from the size of the real economy.
Historical comparisons are striking: the market has only been this expensive on the eve of the tech crash twenty-five years ago. This makes any new bullish episode difficult to justify fundamentally. Yet history also shows that markets can remain overvalued for long periods, especially when liquidity is abundant and investors fear “missing out” on gains.
Seasonality: A Favorable Tailwind at Year-End
Statistically, November and December are the most favorable months for U.S. equities. According to Topdown Charts (1964–2024), November delivers an average return of +1%, positive in 69% of cases, while December rises +1.2% on average, gaining nearly 70% of the time.
Market Paradox: Expensive Yet Bullish?
This coexistence of extreme valuation and seasonal bullish momentum is not unprecedented. In 1999, for instance, the S&P 500 gained over 20% in the six months leading up to its historical peak, even though its CAPE exceeded 40. Investor psychology and flow dynamics often play a more significant role than fundamental reasoning in the short term.
However, such an environment reduces the margin of safety: any macroeconomic shock or earnings disappointment could trigger a sharp correction. History shows that markets can ignore excesses … until the moment they cannot.
Conclusion
The S&P 500 approaches the end of 2025 in a paradoxical situation: supported by historically favorable seasonality but in fundamental weightlessness. November and December could indeed be positive due to bullish inertia, liquidity effects, and collective psychology. Yet at these valuation levels, every additional point of gain also brings the market closer to an inflection point.
DISCLAIMER:
This content is intended for individuals who are familiar with financial markets and instruments and is for information purposes only. The presented idea (including market commentary, market data and observations) is not a work product of any research department of Swissquote or its affiliates. This material is intended to highlight market action and does not constitute investment, legal or tax advice. If you are a retail investor or lack experience in trading complex financial products, it is advisable to seek professional advice from licensed advisor before making any financial decisions.
This content is not intended to manipulate the market or encourage any specific financial behavior.
Swissquote makes no representation or warranty as to the quality, completeness, accuracy, comprehensiveness or non-infringement of such content. The views expressed are those of the consultant and are provided for educational purposes only. Any information provided relating to a product or market should not be construed as recommending an investment strategy or transaction. Past performance is not a guarantee of future results.
Swissquote and its employees and representatives shall in no event be held liable for any damages or losses arising directly or indirectly from decisions made on the basis of this content.
The use of any third-party brands or trademarks is for information only and does not imply endorsement by Swissquote, or that the trademark owner has authorised Swissquote to promote its products or services.
Swissquote is the marketing brand for the activities of Swissquote Bank Ltd (Switzerland) regulated by FINMA, Swissquote Capital Markets Limited regulated by CySEC (Cyprus), Swissquote Bank Europe SA (Luxembourg) regulated by the CSSF, Swissquote Ltd (UK) regulated by the FCA, Swissquote Financial Services (Malta) Ltd regulated by the Malta Financial Services Authority, Swissquote MEA Ltd. (UAE) regulated by the Dubai Financial Services Authority, Swissquote Pte Ltd (Singapore) regulated by the Monetary Authority of Singapore, Swissquote Asia Limited (Hong Kong) licensed by the Hong Kong Securities and Futures Commission (SFC) and Swissquote South Africa (Pty) Ltd supervised by the FSCA.
Products and services of Swissquote are only intended for those permitted to receive them under local law.
All investments carry a degree of risk. The risk of loss in trading or holding financial instruments can be substantial. The value of financial instruments, including but not limited to stocks, bonds, cryptocurrencies, and other assets, can fluctuate both upwards and downwards. There is a significant risk of financial loss when buying, selling, holding, staking, or investing in these instruments. SQBE makes no recommendations regarding any specific investment, transaction, or the use of any particular investment strategy.
CFDs are complex instruments and come with a high risk of losing money rapidly due to leverage. The vast majority of retail client accounts suffer capital losses when trading in CFDs. You should consider whether you understand how CFDs work and whether you can afford to take the high risk of losing your money.
Digital Assets are unregulated in most countries and consumer protection rules may not apply. As highly volatile speculative investments, Digital Assets are not suitable for investors without a high-risk tolerance. Make sure you understand each Digital Asset before you trade.
Cryptocurrencies are not considered legal tender in some jurisdictions and are subject to regulatory uncertainties.
The use of Internet-based systems can involve high risks, including, but not limited to, fraud, cyber-attacks, network and communication failures, as well as identity theft and phishing attacks related to crypto-assets.

SPX to 7450?Looking at the long term chart starting from the covid crash we can see 2 impulse of average 2650 pts and two retracement, so from the trump crash to 4800 we could see one last bullish impulse of around 2650 pts to target 7450 in autumn.
Now I expect a retracement to 5965-5970 area before last bullish impule

S&P500 Is it approaching the end of this Cycle?The S&P500 index (SPX) has been trading within a Bullish Megaphone pattern since the October 2022 bottom of the Inflation Crisis. Since the July 2024 High, it also entered a shorter term Megaphone and those two patterns resemble the 2016 - 2019 Megaphones that emerged straight after the 2015 E.U. crisis and China's slowdown.
As you can see, the 1W RSI sequences among the two fractals are also very similar and the Cycles seem to be repeated with the 1W MA50 (blue trend-line) acting as the Support in times of aggressive uptrends, while the 1W MA200 (orange trend-line) acting as the Support of the Bear Cycles/ correction phases.
The former Megaphone peaked in early 2020 on its 1.618 Fibonacci extension. On the current pattern that Fib is at 7100 and may very well get hit by the end of this year. If it does, the probabilities of a strong technical correction towards the 1W MA200 and the bottom of the long-term Bullish Megaphone, rise dramatically. Especially if at the same time, the 1W RSI turns overbought well above the 70.00 barrier.
It is also worth noting that 1W RSI levels below 35.00 are a strong technical Buy Signal. Long-term investors may seek to use this as a complimentary indicator in case this sharp correction materializes.
So do you think SPX will start correcting if it hits that level by early next year?
-------------------------------------------------------------------------------
** Please LIKE 👍, FOLLOW ✅, SHARE 🙌 and COMMENT ✍ if you enjoy this idea! Also share your ideas and charts in the comments section below! This is best way to keep it relevant, support us, keep the content here free and allow the idea to reach as many people as possible. **
-------------------------------------------------------------------------------
💸💸💸💸💸💸
👇 👇 👇 👇 👇 👇

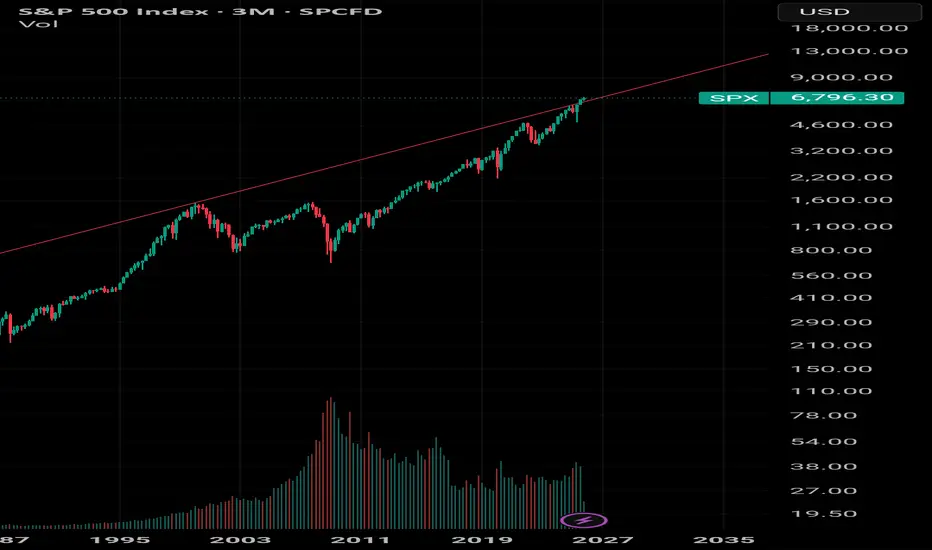
The amazing 100 year S&P log chartI love going back to this chart which tells us everything we need to know when asking the question why is buffet sitting in so much cash. It's an amazing chart and you can see what will Happen, what needs to happen but not when. Needless to say we are still above the red line.
V Pattern In SPX/USDHey fellow traders and followers! Look what I found on the 8hr SPX chart.
Looks like a developing V pattern so far. What could that mean ?
Means up to me.
Here are the numbers; We need to break and hold above the Break Line of 6873.1 area to solidify a long position to Target 1) 6939.7
Target 2) 6966.7
I can't stress enough the importance of the Break Line area being a solid support in order for the trade to have a 8 out of 10 chance to make you money. This move if reached fetches a nice profit $$$ Just look at the points you can gain where I posted it on the chart.
Ok, let's see how things play out... See you at the starting gate $$$

Potential Range Rebalance After Bullish Exhaustion on SP500Based on Candle Range Theory , the recent large bullish range has been followed by a series of smaller bearish candles, showing reduced momentum and potential exhaustion from buyers. Price is currently retracing into the lower range of the previous expansion, indicating that liquidity may be resting below.
If price fails to reclaim the upper range of the previous bullish candle, we could see continuation to the downside as the market seeks equilibrium within or below that expansion range. However, a strong rejection from the lower boundary could confirm range preservation and set up another bullish leg.
In short : the market’s next move depends on whether this retracement turns into a liquidity grab or a deeper correction beneath the prior candle range.
