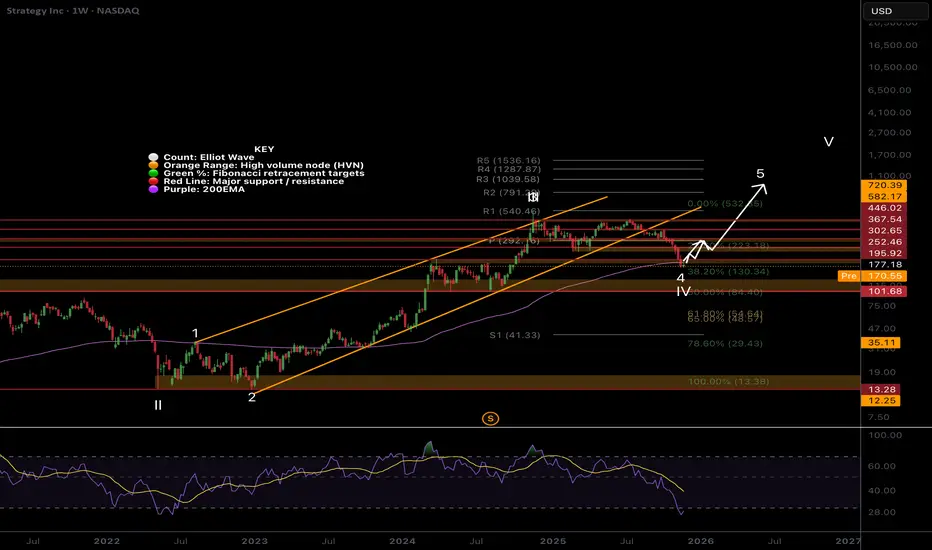
MSTR still bullish. MSTR bullishness is still intact but it should close above the upper yellow line for the bullishness confirmation intact. If that happens then there's a big possibility that we will see a big sharp last parabolic run to new ATH. Of course this is not financial advised.
If this failed then the la
Next report date
—
Report period
—
EPS estimate
—
Revenue estimate
—
26.02 USD
−1.17 B USD
463.46 M USD
267.17 M
About Strategy Inc
Sector
Industry
CEO
Phong Q. Le
Website
Headquarters
Vienna
Founded
1989
ISIN
US5949728613
FIGI
BBG01VC7GB81
Strategy, Inc. engages in the provision of enterprise analytics and mobility software. The firm designs, develops, markets, and sells software platforms through licensing arrangements and cloud-based subscriptions and related services. Its product packages include Hyper. The company was founded by Michael J. Saylor and Sanjeev K. Bansal on November 17, 1989, and is headquartered in Vienna, VA.
Related stocks

MSTR - Ripping Short Squeeze Could Be In The PipelineHas looked terrible for quite some time now.
And although it may not ever make another high, I think it may be time for a hard bounce.
Notice that as Bitcoin hits $94K, it has gone oversold on the week RSI and has re-tested the previous tier - 2024 peak.
For this to be a perfect setup, MSTR would

MSTR when will it end? Soon...NASDAQ:MSTR Sentiment is low, the asset is hated and misunderstood by TradFi and retail. It’s a recipe for a bottom!
Price hit the weekly 200EMA in wave 4. Not much more to add, there is room to fall to $101 High Volume Node, but a bottom should emerge soon.
🎯 Terminal target for the business cyc
MSTR HIGH PROBABILITY LONG SETUP SOON!!!🚨 MSTR HIGH PROBABILITY BUY SETUP 🚨
* Here We Can See Clearly The Next Potential Moves For MSTR Coming Hours/Days.
* Keep Your Eyes Close On Your Trading Positions.
* Happy PIP Hunting Traders.
FXKILLA.

MSTR. Long?Tough call on this one. It is at all time highs and going off fibs. It rejected perfectly at my projection off the yearly move to the high from the past. Now it must hold here or the level below. Not to confident in that though. I personally wouldn't touch this stock for a long until $100 range

MSTR has bottomed out It appears the MSTR has bottomed out and it looks like the big boys have scared all the weak hands. As they are gobbling up positions in bitcoin and MSTR.

MSTR Could Be Forced Out of MSCI — Here’s What That Means📌 Chart Overview
This chart compares MicroStrategy (MSTR) vs Bitcoin (BTC) on a YTD returns basis.
After several years of extreme outperformance, 2025 marks the first major divergence in years:
BINANCE:BTCUSDT YTD: about –4%
NASDAQ:MSTR YTD: about –41%
From highs: MSTR trades ~–63%
This

MSTR in the best valueCan be MSTR go to the moon...since now...
Or the best value between $160 and $140 will be the best price to begin buy mstr. And it could be go to the MOON.
MSTR Swing Watch: Bullish Momentum AheadMSTR QuantSignals Katy 1M Prediction 2025-11-25
Ticker: MSTR
Signal Type: 1-Month Short-Term Prediction
Direction: CALL (LONG)
Confidence: 63.8% (Medium conviction)
Current Price: $168.47
Entry: $168.47
Target 1: $171.25
Final Prediction: $171.95 (+2.07%)
30min Target: $172.28 (+2.26%)
Stop Loss: $

Best Ways of Trading1. Trade with a Clear Strategy (Not Emotion or Guesswork)
One of the biggest mistakes new traders make is trading without a defined plan. The best way to trade is to follow a tested strategy. Some proven trading styles include:
a) Trend Trading
This approach involves identifying the overall marke

See all ideas
Summarizing what the indicators are suggesting.
Oscillators
Neutral
SellBuy
Strong sellStrong buy
Strong sellSellNeutralBuyStrong buy
Oscillators
Neutral
SellBuy
Strong sellStrong buy
Strong sellSellNeutralBuyStrong buy
Summary
Neutral
SellBuy
Strong sellStrong buy
Strong sellSellNeutralBuyStrong buy
Summary
Neutral
SellBuy
Strong sellStrong buy
Strong sellSellNeutralBuyStrong buy
Summary
Neutral
SellBuy
Strong sellStrong buy
Strong sellSellNeutralBuyStrong buy
Moving Averages
Neutral
SellBuy
Strong sellStrong buy
Strong sellSellNeutralBuyStrong buy
Moving Averages
Neutral
SellBuy
Strong sellStrong buy
Strong sellSellNeutralBuyStrong buy
US594972AQ4
Strategy Inc 0.625% 15-SEP-2028Yield to maturity
—
Maturity date
Sep 15, 2028
MSTR6032672
Strategy Inc 0.625% 15-MAR-2030Yield to maturity
—
Maturity date
Mar 15, 2030
US594972AT8
Strategy Inc 0.0% 01-MAR-2030Yield to maturity
—
Maturity date
Mar 1, 2030
MSTR6034213
Strategy Inc 0.875% 15-MAR-2031Yield to maturity
—
Maturity date
Mar 15, 2031
US594972AN1
Strategy Inc 2.25% 15-JUN-2032Yield to maturity
—
Maturity date
Jun 15, 2032
MSTR6242992
Strategy Inc 0.0% 01-DEC-2029Yield to maturity
—
Maturity date
Dec 1, 2029
See all STRD bonds
XPF
iShares S&P/TSX North American Preferred Stock Index ETF (CAD-Hedged) Trust UnitsWeight
0.36%
Market value
612.44 K
USD
Explore more ETFs
Curated watchlists where STRD is featured.


Frequently Asked Questions
The current price of STRD is 78.85 USD — it has decreased by −0.14% in the past 24 hours. Watch Strategy Inc - 10.00% Series A Perpetual Stride Preferred Stock stock price performance more closely on the chart.
Depending on the exchange, the stock ticker may vary. For instance, on NASDAQ exchange Strategy Inc - 10.00% Series A Perpetual Stride Preferred Stock stocks are traded under the ticker STRD.
STRD stock has risen by 12.78% compared to the previous week, the month change is a −1.41% fall, over the last year Strategy Inc - 10.00% Series A Perpetual Stride Preferred Stock has showed a −8.05% decrease.
STRD reached its all-time high on Jul 14, 2025 with the price of 96.81 USD, and its all-time low was 64.17 USD and was reached on Nov 19, 2025. View more price dynamics on STRD chart.
See other stocks reaching their highest and lowest prices.
See other stocks reaching their highest and lowest prices.
STRD stock is 3.02% volatile and has beta coefficient of 1.05. Track Strategy Inc - 10.00% Series A Perpetual Stride Preferred Stock stock price on the chart and check out the list of the most volatile stocks — is Strategy Inc - 10.00% Series A Perpetual Stride Preferred Stock there?
Today Strategy Inc - 10.00% Series A Perpetual Stride Preferred Stock has the market capitalization of 49.26 B, it has decreased by −1.04% over the last week.
Yes, you can track Strategy Inc - 10.00% Series A Perpetual Stride Preferred Stock financials in yearly and quarterly reports right on TradingView.
Strategy Inc - 10.00% Series A Perpetual Stride Preferred Stock is going to release the next earnings report on Feb 3, 2026. Keep track of upcoming events with our Earnings Calendar.
STRD earnings for the last quarter are 8.42 USD per share, whereas the estimation was −0.10 USD resulting in a 8.35 K% surprise. The estimated earnings for the next quarter are −0.08 USD per share. See more details about Strategy Inc - 10.00% Series A Perpetual Stride Preferred Stock earnings.
Strategy Inc - 10.00% Series A Perpetual Stride Preferred Stock revenue for the last quarter amounts to 128.69 M USD, despite the estimated figure of 116.65 M USD. In the next quarter, revenue is expected to reach 118.75 M USD.
STRD net income for the last quarter is 2.79 B USD, while the quarter before that showed 10.02 B USD of net income which accounts for −72.21% change. Track more Strategy Inc - 10.00% Series A Perpetual Stride Preferred Stock financial stats to get the full picture.
Yes, STRD dividends are paid quarterly. The last dividend per share was 3.06 USD. As of today, Dividend Yield (TTM)% is 0.00%. Tracking Strategy Inc - 10.00% Series A Perpetual Stride Preferred Stock dividends might help you take more informed decisions.
As of Dec 3, 2025, the company has 1.53 K employees. See our rating of the largest employees — is Strategy Inc - 10.00% Series A Perpetual Stride Preferred Stock on this list?
Like other stocks, STRD shares are traded on stock exchanges, e.g. Nasdaq, Nyse, Euronext, and the easiest way to buy them is through an online stock broker. To do this, you need to open an account and follow a broker's procedures, then start trading. You can trade Strategy Inc - 10.00% Series A Perpetual Stride Preferred Stock stock right from TradingView charts — choose your broker and connect to your account.