MSTR might be on a 50% retraceIf you use the channel low/top as anchors, we're on a 50% level... lots of things seem to be aligning. I expect a decent bounce here and potentially a bottom
Strategy Inc - 8.00% Series A Perpetual Strike Preferred Stock
No trades
Next report date
—
Report period
—
EPS estimate
—
Revenue estimate
—
26.02 USD
−1.17 B USD
463.46 M USD
267.17 M
About Strategy Inc
Sector
Industry
CEO
Phong Q. Le
Website
Headquarters
Vienna
Founded
1989
Identifiers
3
ISIN US5949728878
Strategy, Inc. engages in the provision of enterprise analytics and mobility software. The firm designs, develops, markets, and sells software platforms through licensing arrangements and cloud-based subscriptions and related services. Its product packages include Hyper. The company was founded by Michael J. Saylor and Sanjeev K. Bansal on November 17, 1989, and is headquartered in Vienna, VA.
Related stocks

01/27/2026 MSTR/MSTU LongHello traders,
I’m neutral on Bitcoin for now, but I’m bullish on MSTR/MSTU. The hammer candle on the 4-hour timeframe suggests upside potential from here. After consolidating within a tight range for several days, MSTR appears ready for a breakout. My conservative Take Profit (TP) is the R1 tren

MSTR LongMSTR: Long From Key Demand With Up to 50% Upside
Description:
MicroStrategy is trading inside a major higher-timeframe demand zone after a deep corrective move.
Analyst sentiment remains supportive, with 13 analysts rating MSTR as Strong Buy. While long-term targets are higher, this setup focuses o

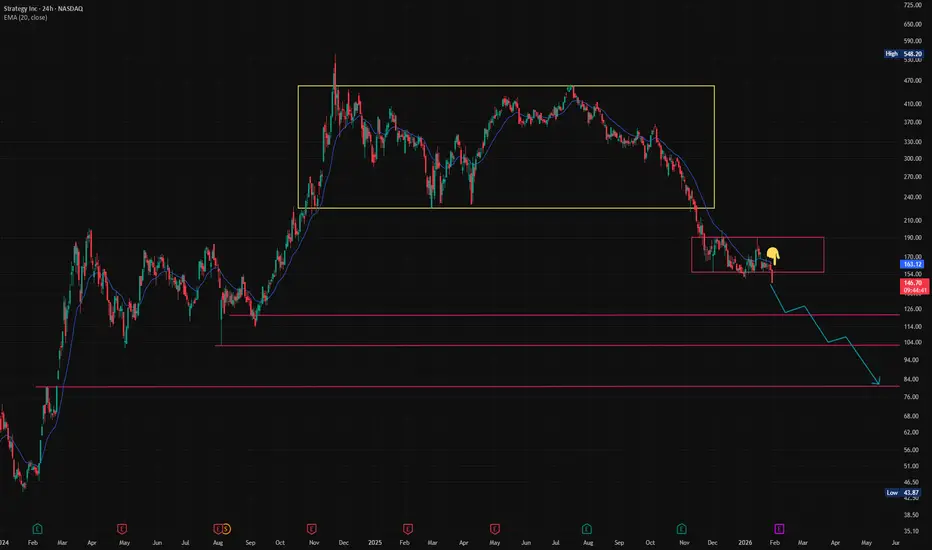
Shorted $MSTR the open today. 3 reasons:Why? 👇
1. Strategy had been in range since November. The next phase is always a breakout.
2. The lower high (top pink box) did not hit the previous range (yellow box). This is a tell that a strong bear trend is coming.
3. CRYPTOCAP:BTC is likely to hit at least 70K, See my previous posting for
MSTR MicroStrategy YES For a PUMP Into Early Next WeekHello everyone, please give this idea a boost and follow me here on TW for my regular critical updates on Bitcoin, Ethereum, Solana, MicroStrategy, Gold & Silver based off Martin Armstrong's Socrates.
I admit that I was getting really bored 😒 but after the GOLD explosion just moments ago and cryp

MSTR Short-term analysis | Trading and expectationsNASDAQ:MSTR
🎯 Price dropped hard wave Y of 4, invalidating the previous analysis. Wave Y can complete any time in this flat correction pattern, but is approaching the 0.382 Fibonacci retracement, a high probability bottom.
📈 Daily RSI printed hidden bearish divergence, suggesting lower to come
👉

MSTR MicroStrategy ¡Really BULLISH Next 3 Months!Hello everyone, please give this idea a boost and follow me here on TW for my regular critical updates on Bitcoin, Ethereum, Solana, MicroStrategy, Gold & Silver, based off Martin Armstrong's Socrates.
Real GREAT news for MSTR 😮🚨 Since October MSTR was going through a WATERFALL EVENT on ALL tim

1/29/26 - $mstr - rough seas but swing here1/29/26 :: VROCKSTAR :: NASDAQ:MSTR
rough seas but swing here
- 1.03x mnav is too cheap
- go check out the copper/gold pair as i wrote about y day about btc thoughts
- we are likely not out of the woods, remember bottoms are events, not patterns (like tops... see last year+ for what a topping/ di

MSTR MicroStrategy ¡CRITICAL UPDATE! As Bullish As It GetsHello! Please give this idea a boost and follow me here on TW for my regular critical updates on crypto (BTC, ETH, SOL, MSTR) and metals (GLD, SL, PL) based on Martin Armstrong's Socrates.
Well! what an awful crypto breakdown along with everything else 😢 I guess I'm just thankful that I did not ge

$MSTR has potential to explode- NASDAQ:MSTR curling around 200 day weekly average
- Buyers stepping in and ready for the rocket launch?

See all ideas
Summarizing what the indicators are suggesting.
Oscillators
Neutral
SellBuy
Strong sellStrong buy
Strong sellSellNeutralBuyStrong buy
Oscillators
Neutral
SellBuy
Strong sellStrong buy
Strong sellSellNeutralBuyStrong buy
Summary
Neutral
SellBuy
Strong sellStrong buy
Strong sellSellNeutralBuyStrong buy
Summary
Neutral
SellBuy
Strong sellStrong buy
Strong sellSellNeutralBuyStrong buy
Summary
Neutral
SellBuy
Strong sellStrong buy
Strong sellSellNeutralBuyStrong buy
Moving Averages
Neutral
SellBuy
Strong sellStrong buy
Strong sellSellNeutralBuyStrong buy
Moving Averages
Neutral
SellBuy
Strong sellStrong buy
Strong sellSellNeutralBuyStrong buy
Displays a symbol's price movements over previous years to identify recurring trends.
MSTR6034213
Strategy Inc 0.875% 15-MAR-2031Yield to maturity
—
Maturity date
Mar 15, 2031
US594972AT8
Strategy Inc 0.0% 01-MAR-2030Yield to maturity
—
Maturity date
Mar 1, 2030
MSTR6032672
Strategy Inc 0.625% 15-MAR-2030Yield to maturity
—
Maturity date
Mar 15, 2030
US594972AN1
Strategy Inc 2.25% 15-JUN-2032Yield to maturity
—
Maturity date
Jun 15, 2032
MSTR6242992
Strategy Inc 0.0% 01-DEC-2029Yield to maturity
—
Maturity date
Dec 1, 2029
US594972AQ4
Strategy Inc 0.625% 15-SEP-2028Yield to maturity
—
Maturity date
Sep 15, 2028
See all STRK bonds
XPF
iShares S&P/TSX North American Preferred Stock Index ETF (CAD-Hedged) Trust UnitsWeight
0.44%
Market value
772.44 K
USD
Explore more ETFs
Frequently Asked Questions
The current price of STRK is 84.99 USD — it has increased by 3.87% in the past 24 hours. Watch Strategy Inc - 8.00% Series A Perpetual Strike Preferred Stock stock price performance more closely on the chart.
Depending on the exchange, the stock ticker may vary. For instance, on NASDAQ exchange Strategy Inc - 8.00% Series A Perpetual Strike Preferred Stock stocks are traded under the ticker STRK.
STRK stock has fallen by −0.56% compared to the previous week, the month change is a 3.65% rise, over the last year Strategy Inc - 8.00% Series A Perpetual Strike Preferred Stock has showed a 5.58% increase.
STRK reached its all-time high on Jul 11, 2025 with the price of 129.48 USD, and its all-time low was 73.08 USD and was reached on Nov 19, 2025. View more price dynamics on STRK chart.
See other stocks reaching their highest and lowest prices.
See other stocks reaching their highest and lowest prices.
STRK stock is 6.81% volatile and has beta coefficient of 1.38. Track Strategy Inc - 8.00% Series A Perpetual Strike Preferred Stock stock price on the chart and check out the list of the most volatile stocks — is Strategy Inc - 8.00% Series A Perpetual Strike Preferred Stock there?
Today Strategy Inc - 8.00% Series A Perpetual Strike Preferred Stock has the market capitalization of 43.02 B, it has decreased by −1.36% over the last week.
Yes, you can track Strategy Inc - 8.00% Series A Perpetual Strike Preferred Stock financials in yearly and quarterly reports right on TradingView.
Strategy Inc - 8.00% Series A Perpetual Strike Preferred Stock is going to release the next earnings report on Feb 5, 2026. Keep track of upcoming events with our Earnings Calendar.
STRK earnings for the last quarter are 8.42 USD per share, whereas the estimation was −0.10 USD resulting in a 8.35 K% surprise. The estimated earnings for the next quarter are −0.08 USD per share. See more details about Strategy Inc - 8.00% Series A Perpetual Strike Preferred Stock earnings.
Strategy Inc - 8.00% Series A Perpetual Strike Preferred Stock revenue for the last quarter amounts to 128.69 M USD, despite the estimated figure of 116.65 M USD. In the next quarter, revenue is expected to reach 119.12 M USD.
STRK net income for the last quarter is 2.79 B USD, while the quarter before that showed 10.02 B USD of net income which accounts for −72.21% change. Track more Strategy Inc - 8.00% Series A Perpetual Strike Preferred Stock financial stats to get the full picture.
Yes, STRK dividends are paid quarterly. The last dividend per share was 2.00 USD. As of today, Dividend Yield (TTM)% is 0.00%. Tracking Strategy Inc - 8.00% Series A Perpetual Strike Preferred Stock dividends might help you take more informed decisions.
As of Feb 2, 2026, the company has 1.53 K employees. See our rating of the largest employees — is Strategy Inc - 8.00% Series A Perpetual Strike Preferred Stock on this list?
EBITDA measures a company's operating performance, its growth signifies an improvement in the efficiency of a company. Strategy Inc - 8.00% Series A Perpetual Strike Preferred Stock EBITDA is −7.24 M USD, and current EBITDA margin is −5.29%. See more stats in Strategy Inc - 8.00% Series A Perpetual Strike Preferred Stock financial statements.
Like other stocks, STRK shares are traded on stock exchanges, e.g. Nasdaq, Nyse, Euronext, and the easiest way to buy them is through an online stock broker. To do this, you need to open an account and follow a broker's procedures, then start trading. You can trade Strategy Inc - 8.00% Series A Perpetual Strike Preferred Stock stock right from TradingView charts — choose your broker and connect to your account.
Investing in stocks requires a comprehensive research: you should carefully study all the available data, e.g. company's financials, related news, and its technical analysis. So Strategy Inc - 8.00% Series A Perpetual Strike Preferred Stock technincal analysis shows the neutral today, and its 1 week rating is sell. Since market conditions are prone to changes, it's worth looking a bit further into the future — according to the 1 month rating Strategy Inc - 8.00% Series A Perpetual Strike Preferred Stock stock shows the buy signal. See more of Strategy Inc - 8.00% Series A Perpetual Strike Preferred Stock technicals for a more comprehensive analysis.
If you're still not sure, try looking for inspiration in our curated watchlists.
If you're still not sure, try looking for inspiration in our curated watchlists.