STRKUSD Bullish Study Case
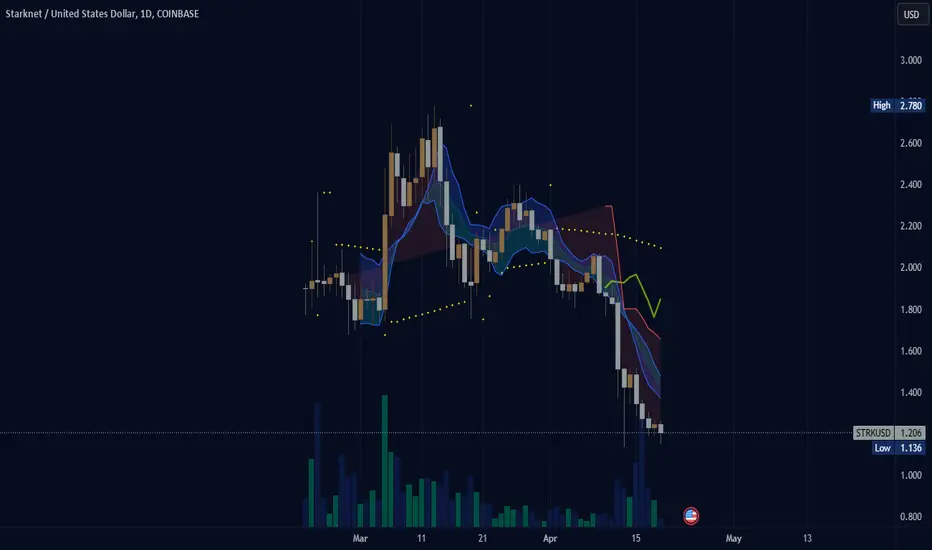
On the daily timeframe, STRK was in a bearish trend. Then, it started forming the Wyckoff accumulation pattern, which included a bearish candle with a long wick, marked on the graph as SC for Selling Climax. Then, we had the AR for Automatic Reaction, followed by the ST for Secondary Test, UT for Upthrust, and another STB for Secondary Test in Phase B.
Currently, I'm waiting for the retest that aligns with an inverse head and shoulders pattern in the 4-hour timeframe. Additionally, it aligns with a Fibonnaci's zone of interest.
STRKUSD trade ideas

(STRK) starknet tokenStarknet token on Base chain. Is it a viable contender in the future for cryptocurrency? I do'nt see why not. Why would coinbase add this token to their ... does Coinbase add or do people build on Base whether Base likes it or not? There was a problem with Binance Chain now BNB chain in the past with too many bad programs using BNB chain for their ill willed intentions.
STRK-USD: StarkNet ready to excel?2024-03-11 Starknet STRK
Starknet is a coin that has been on major exchanges for only a few weeks.
Some analysts speak highly of it, as potential multiplier of our funds.
After some struggles getting a footing, it appears ready for a breakout for 2x gain.

$STRK upside $4-9?IDX:STRK looks like it has the potential to make a strong move here. It has a very similar look to SPARKS:AERO before it went up ~7x.
While I don't think it'll be as strong of a move, I do think there's good potential for upside.
Let's see what happens. Price needs to confirm resistance as support before it has the chance to move.
I've entered from $2.27.
