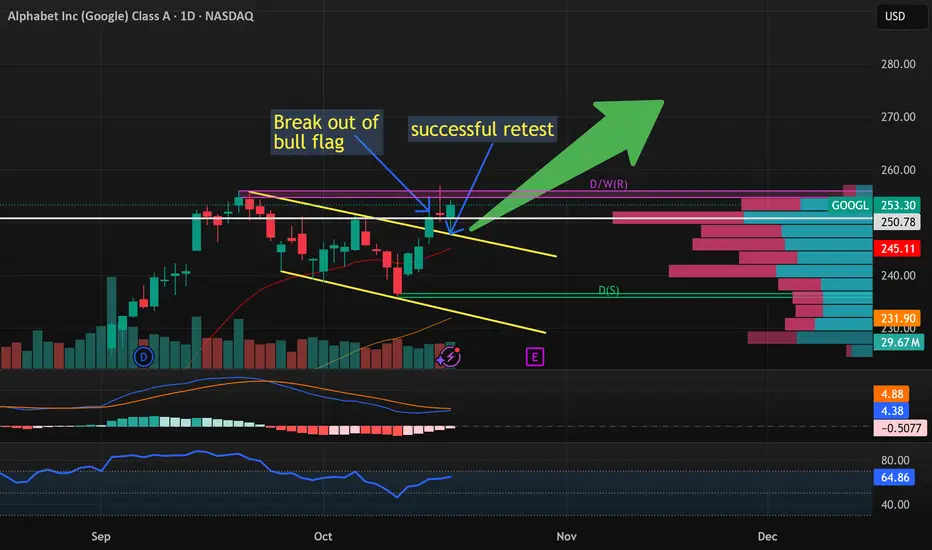
Bull run for GOOGL incoming?Google just pushed out of it's bearish flag channel. Then, on Friday it successfully retested it.
Trading at a forward of P/E of 19.6x which is the lowest of all the Mag7.
Ideally I'd like to see GOOGL break the ATH support and trade the breakout.
But that this point already, I will likely begin to
Key facts today
Next report date
—
Report period
—
EPS estimate
—
Revenue estimate
—
8.05 EUR
96.71 B EUR
337.91 B EUR
5.04 B
About Alphabet Inc (Google) Class C
Sector
Industry
CEO
Sundar Pichai
Website
Headquarters
Mountain View
Founded
2015
ISIN
US02079K1079
FIGI
BBG00B4YYSB5
Alphabet, Inc. is a holding company, which engages in software, health care, transportation, and other technologies. It operates through the following segments: Google Services, Google Cloud, and Other Bets. The Google Services segment includes products and services, such as ads, Android, Chrome, devices, Google Maps, Google Play, Search, and YouTube. The Google Cloud segment refers to infrastructure and platform services, collaboration tools, and other services for enterprise customers. The Other Bets segment relates to the sale of healthcare-related services and internet services. The company was founded by Lawrence E. Page and Sergey Mikhaylovich Brin on October 2, 2015 and is headquartered in Mountain View, CA.
Related stocks
GOOG is breaking a bull flagThis October, Google has formed a textbook bull flag pattern. If price breaks to the upside, we could see the current rally continue for several more days.
Many analysts (BMO, TMC or HSBC among others) have recently placed GOOG’s target area between $285–$300, which aligns perfectly with the tec

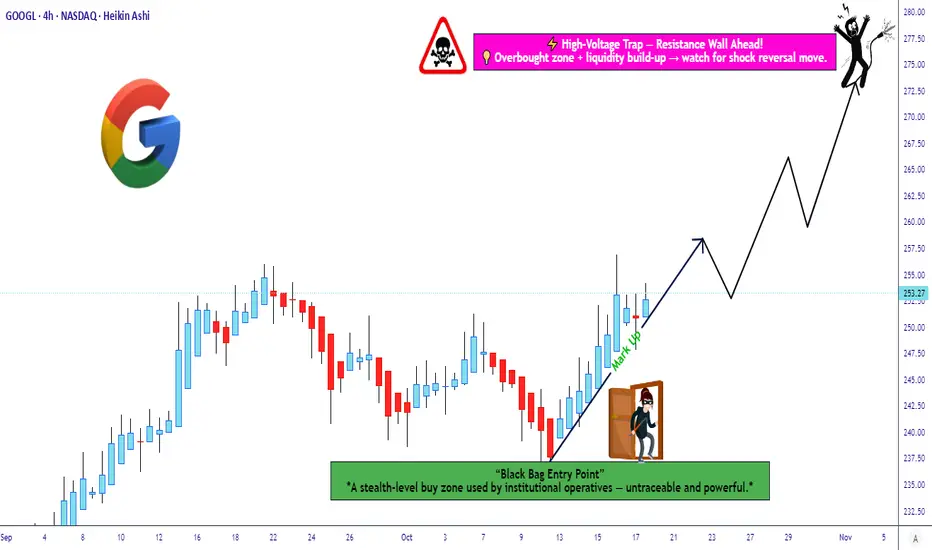
Is This the Perfect Entry Zone for the Next GOOGL Upside Run?🎯 GOOGL: The "Thief's Heist" Trading Strategy | Layered Entry Playbook 📊
💼 Asset: ALPHABET INC. (GOOGL)
Market: NASDAQ | Style: Swing/Day Trade Hybrid
🎭 The Setup: Bulls Running the Show
Bias: 🟢 BULLISH
Listen up, trading family! 👋 GOOGL is setting up what I call the "Thief's Entry Strategy" - a l
GOOGL Oct. 22–24 Outlook: “Alphabet Midweek Breakout SetupBulls Eye $260 Gamma Target into Friday Close 🔥
🕒 Daily Timeframe – Macro Bias and Market Structure
GOOGL remains in a strong macro uptrend, riding the ascending channel it’s respected since summer.
Recent structure shows a CHoCH → BOS → CHoCH pattern near the $250–$255 range, signaling that smart
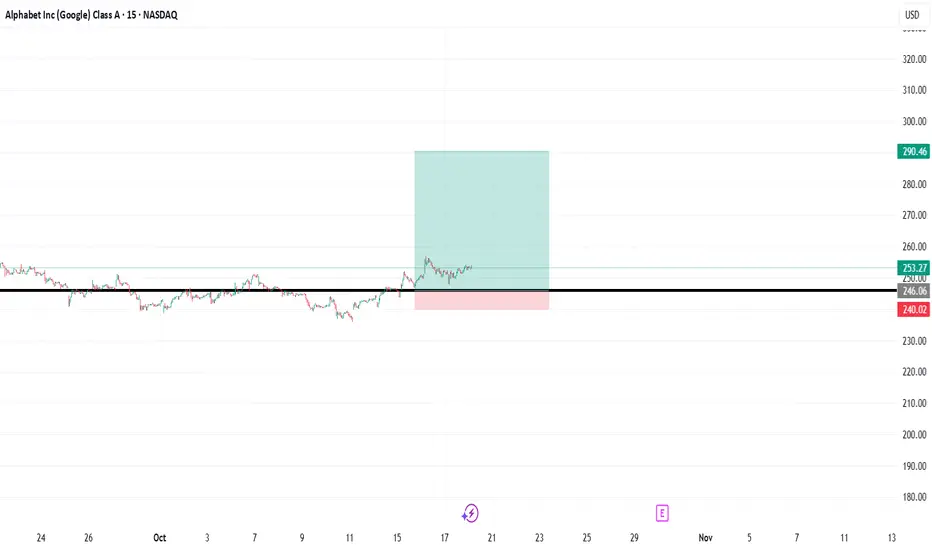
GOOGL Long Setup: Retest of Former Resistance as SupportHello TradingView Community,
This post outlines a potential long trade setup for Alphabet Inc (GOOGL) on the 15-minute chart.
Technical Analysis:
The chart highlights a key horizontal price level at approximately $246.06. This level previously acted as a significant resistance, capping the price on
GOOGL Friday Momentum Test – Oct. 17Bulls Defend the Trendline as Gamma Builds Near $251🔥”
📊 Multi-Timeframe Breakdown
🕒 1. Daily Chart – Macro Structure (“The Why”)
GOOGL’s overall macro trend remains bullish after months of consistent higher highs and higher lows. The recent CHoCH near $253–$255 signals a temporary cooling phase fo

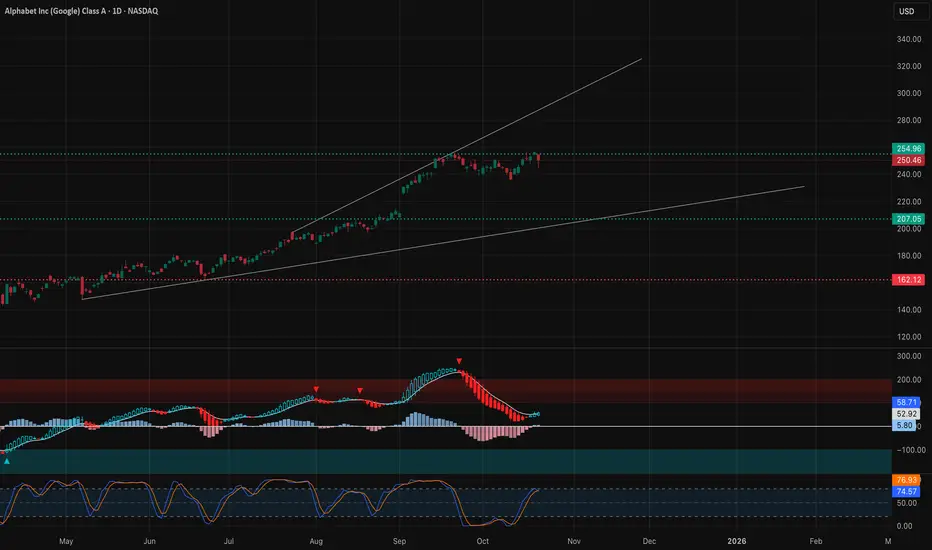
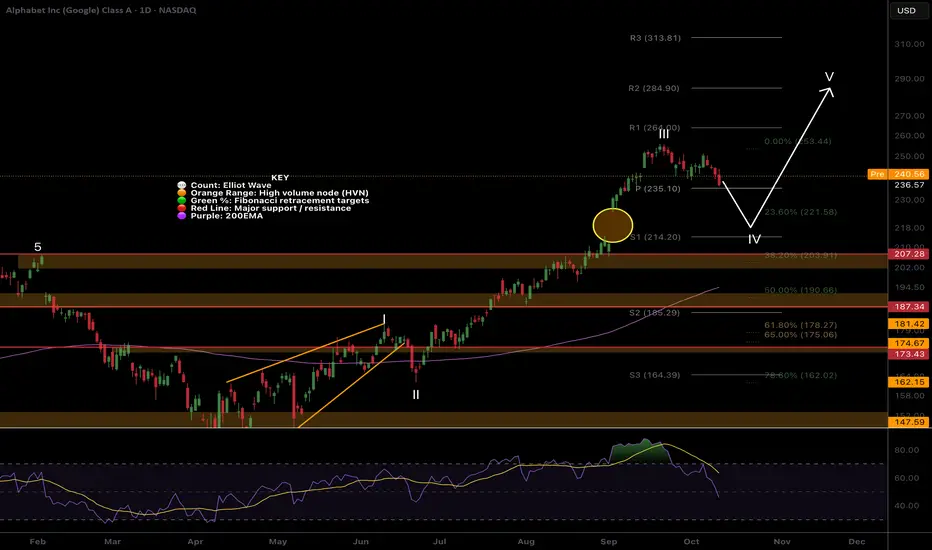
Google ready for higher!I am liking the look of NASDAQ:GOOG for another push to all time high before lower to complete macro elliot wave 3.
Wave 4 has typical target of the 0.382 Fibonacci retracement which sits at the previous all time high and also fils the gap left and meets the daily 200EMA! Lots of confluence and
$GOOG Flag breakout These are simple breakout plays. Wait for retest of support then enter longs up to dbl top and leave some runners for the big win.

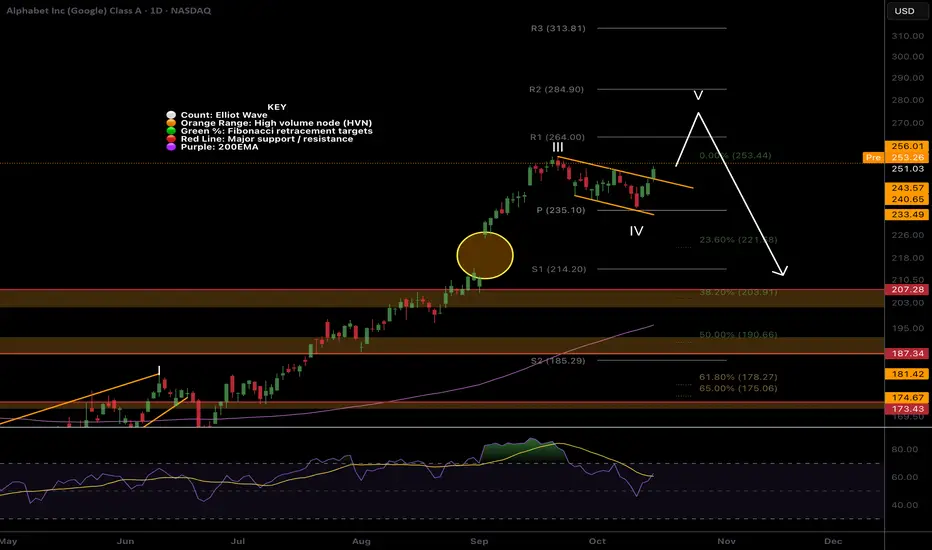
Google Gap fill + wave 4?Google has had a great run into price discovery in wave III uptrend but now appears exhausted and ready for a short term pullback setting up new signals.
The gap looks likely to be filled as coinciding the wave IV Fibonacci targets and the S1 daily pivot.
RSI is making its way into oversold with p
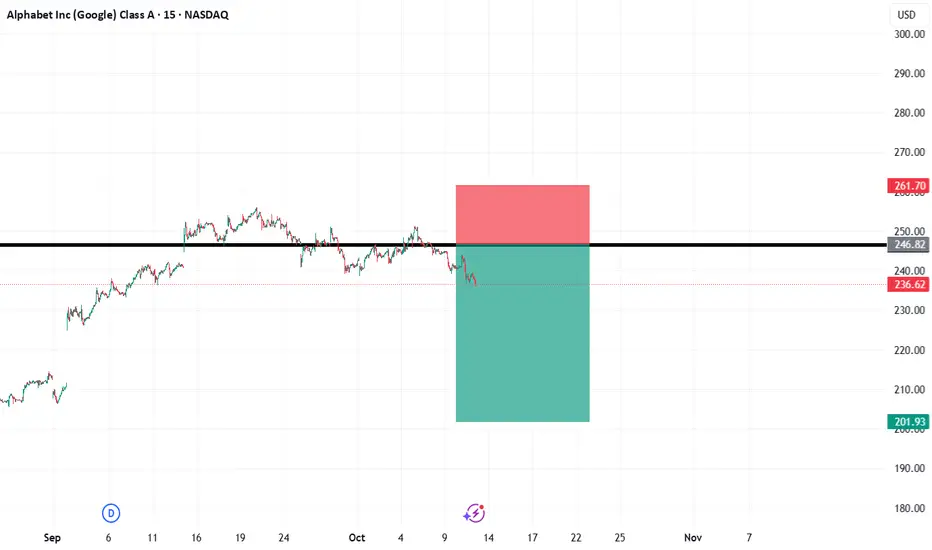
GOOGL Short Setup: Former Support Acting as New ResistanceHello TradingView Community,
This post outlines a potential short trade setup for Alphabet Inc (GOOGL) on the 15-minute timeframe.
Technical Analysis:
The chart highlights a key horizontal price level at approximately $246.82. This level previously served as a solid support zone, holding the price u
See all ideas
Summarizing what the indicators are suggesting.
Neutral
SellBuy
Strong sellStrong buy
Strong sellSellNeutralBuyStrong buy
Neutral
SellBuy
Strong sellStrong buy
Strong sellSellNeutralBuyStrong buy
Neutral
SellBuy
Strong sellStrong buy
Strong sellSellNeutralBuyStrong buy
An aggregate view of professional's ratings.
Neutral
SellBuy
Strong sellStrong buy
Strong sellSellNeutralBuyStrong buy
Neutral
SellBuy
Strong sellStrong buy
Strong sellSellNeutralBuyStrong buy
Neutral
SellBuy
Strong sellStrong buy
Strong sellSellNeutralBuyStrong buy
Displays a symbol's price movements over previous years to identify recurring trends.
GOOG6065579
Alphabet Inc. 5.3% 15-MAY-2065Yield to maturity
5.19%
Maturity date
May 15, 2065
GOOG6065578
Alphabet Inc. 5.25% 15-MAY-2055Yield to maturity
5.09%
Maturity date
May 15, 2055
US2079KAF4
Alphabet Inc. 2.05% 15-AUG-2050Yield to maturity
5.03%
Maturity date
Aug 15, 2050
US2079KAG2
Alphabet Inc. 2.25% 15-AUG-2060Yield to maturity
4.98%
Maturity date
Aug 15, 2060
US2079KAE7
Alphabet Inc. 1.9% 15-AUG-2040Yield to maturity
4.81%
Maturity date
Aug 15, 2040
GOOG6065581
Alphabet Inc. 4.5% 15-MAY-2035Yield to maturity
4.35%
Maturity date
May 15, 2035
XS306443038
Alphabet Inc. 4.0% 06-MAY-2054Yield to maturity
4.02%
Maturity date
May 6, 2054
US2079KAC1
Alphabet Inc. 1.998% 15-AUG-2026Yield to maturity
3.92%
Maturity date
Aug 15, 2026
XS306442783
Alphabet Inc. 3.875% 06-MAY-2045Yield to maturity
3.86%
Maturity date
May 6, 2045
US2079KAD9
Alphabet Inc. 1.1% 15-AUG-2030Yield to maturity
3.77%
Maturity date
Aug 15, 2030
GOOG6065580
Alphabet Inc. 4.0% 15-MAY-2030Yield to maturity
3.74%
Maturity date
May 15, 2030
See all ABEC bonds
Curated watchlists where ABEC is featured.


Frequently Asked Questions
The current price of ABEC is 218.25 EUR — it has decreased by −3.49% in the past 24 hours. Watch Alphabet Inc. Class C stock price performance more closely on the chart.
Depending on the exchange, the stock ticker may vary. For instance, on SWB exchange Alphabet Inc. Class C stocks are traded under the ticker ABEC.
ABEC stock has risen by 1.77% compared to the previous week, the month change is a −0.72% fall, over the last year Alphabet Inc. Class C has showed a 42.95% increase.
We've gathered analysts' opinions on Alphabet Inc. Class C future price: according to them, ABEC price has a max estimate of 293.03 EUR and a min estimate of 163.75 EUR. Watch ABEC chart and read a more detailed Alphabet Inc. Class C stock forecast: see what analysts think of Alphabet Inc. Class C and suggest that you do with its stocks.
ABEC reached its all-time high on Oct 16, 2025 with the price of 218.85 EUR, and its all-time low was 27.85 EUR and was reached on Oct 8, 2015. View more price dynamics on ABEC chart.
See other stocks reaching their highest and lowest prices.
See other stocks reaching their highest and lowest prices.
ABEC stock is 4.01% volatile and has beta coefficient of 1.00. Track Alphabet Inc. Class C stock price on the chart and check out the list of the most volatile stocks — is Alphabet Inc. Class C there?
Today Alphabet Inc. Class C has the market capitalization of 2.62 T, it has increased by 2.73% over the last week.
Yes, you can track Alphabet Inc. Class C financials in yearly and quarterly reports right on TradingView.
Alphabet Inc. Class C is going to release the next earnings report on Oct 29, 2025. Keep track of upcoming events with our Earnings Calendar.
ABEC earnings for the last quarter are 1.96 EUR per share, whereas the estimation was 1.85 EUR resulting in a 5.82% surprise. The estimated earnings for the next quarter are 1.95 EUR per share. See more details about Alphabet Inc. Class C earnings.
Alphabet Inc. Class C revenue for the last quarter amounts to 81.86 B EUR, despite the estimated figure of 79.83 B EUR. In the next quarter, revenue is expected to reach 85.12 B EUR.
ABEC net income for the last quarter is 23.94 B EUR, while the quarter before that showed 31.93 B EUR of net income which accounts for −25.03% change. Track more Alphabet Inc. Class C financial stats to get the full picture.
Yes, ABEC dividends are paid quarterly. The last dividend per share was 0.18 EUR. As of today, Dividend Yield (TTM)% is 0.33%. Tracking Alphabet Inc. Class C dividends might help you take more informed decisions.
Alphabet Inc. Class C dividend yield was 0.32% in 2024, and payout ratio reached 7.46%. The year before the numbers were 0.00% and 0.00% correspondingly. See high-dividend stocks and find more opportunities for your portfolio.
As of Oct 22, 2025, the company has 183.32 K employees. See our rating of the largest employees — is Alphabet Inc. Class C on this list?
EBITDA measures a company's operating performance, its growth signifies an improvement in the efficiency of a company. Alphabet Inc. Class C EBITDA is 117.88 B EUR, and current EBITDA margin is 36.45%. See more stats in Alphabet Inc. Class C financial statements.
Like other stocks, ABEC shares are traded on stock exchanges, e.g. Nasdaq, Nyse, Euronext, and the easiest way to buy them is through an online stock broker. To do this, you need to open an account and follow a broker's procedures, then start trading. You can trade Alphabet Inc. Class C stock right from TradingView charts — choose your broker and connect to your account.
Investing in stocks requires a comprehensive research: you should carefully study all the available data, e.g. company's financials, related news, and its technical analysis. So Alphabet Inc. Class C technincal analysis shows the buy rating today, and its 1 week rating is buy. Since market conditions are prone to changes, it's worth looking a bit further into the future — according to the 1 month rating Alphabet Inc. Class C stock shows the strong buy signal. See more of Alphabet Inc. Class C technicals for a more comprehensive analysis.
If you're still not sure, try looking for inspiration in our curated watchlists.
If you're still not sure, try looking for inspiration in our curated watchlists.