Google is looking bullisbThis chart looks way bullish. I il do the breakdown soon.
If you have any doubts you can DM me here
ABEC trade ideas

GOOGL BreakoutGOOGL has been a strong name all year, in part because of AI hype among other things such as stock buy backs. It just broke out of a downtrend and I expect it to be a top performer if NQ continues to make new all time highs.

$GOOGL triangle breakdown from ATHPretty simple here, the negative news catalyst has given the bears something to eat. Looking to play this short into the gap area below!!

Potential Bullish Continuation from $132 to $137-$139NASDAQ:GOOGL potentially reaching $141-$143 within the next three weeks or as high as potentially reaching $141-$143 within the next three weeks if there is any new news on advancements (or partnerships).
The Elliott Wave Principle suggests a potential bullish continuation within a larger Wave 3. A breakout above $133.34 could propel the stock towards $137.50-$139.50 within Wave 3's Subwave 5.
Retracement levels at $135.70 and $138.50 could act as potential support zones for further upward momentum.
Bollinger Bands and Keltner Channels currently suggest low volatility, potentially indicating a breakout soon
Recent news regarding Google AI advancements and cloud platform partnerships has generated positive sentiment.
Google's consistent revenue and earnings growth contribute to positive investor sentiment.
Moving averages and RSI suggest potential for further upward momentum.
Slightly positive (65% positive, 35% neutral/negative)
Mixed (48% positive, 42% neutral, 10% negative)
Neutral to Slightly positive (52% positive, 48% neutral)
Recent High-frequency data options trading activity suggests a slight upward bias, potentially indicating cautious optimism .
Mentions of "Google AI" and "Google Cloud" have increased in the past few days, suggesting growing interest but not necessarily widespread positive sentiment.
The Machine Learning Model predicts a 60% probability of a neutral earnings surprise, with a 20% chance of a positive surprise and 20% chance of a negative surprise.

Googl absolute buy zoneGoogl is probably my largest future bet going forward. After the most recent earnings and a very thoughtful analysis, I find it to be the best value of the Mag 7, followed by Amazon. I go with A class shares since they offer voting power and are likely more popular. My plan for this stock is to buy 2026 Jan leaps likely around 150$, and sell covered calls against the position. If I am close to assignment I may roll, or allow the leaps to move. I do plan on exercising at least one of these in 2026 at the 150$ range since I believe this is an amazing company.
-165 UPCOM:ISH is an amazing deal, the company was valued at 164 using discounted cash flow model in Q1
-Low forward PE in an overheated market
-Extremely high cash flows
-Expanding cloud revenue
-Slept on in the Ai market, they control the data, therefore their Ai presence will be huge
-Large moat, people like to use google, youtube, and the cloud is expanding
$133 to $140 on 30m chart 2023-12 to 2024-02$133 to $140 on 30m chart 2023-12 to 2024-02
1-day Chart ( click to play ):
NASDAQ:GOOGL potentially reaching $133-$140 within the next three weeks or as high as $141-$143 if there is any new news on advancements (or partnerships).
The Elliott Wave Principle suggests a potential bullish continuation within a larger Wave 3. A breakout above $133.34 could propel the stock towards $137.50-$139.50 within Wave 3's Subwave 5.
Retracement levels at $135.70 and $138.50 could act as potential support zones for further upward momentum.
Bollinger Bands and Keltner Channels currently suggest low volatility, potentially indicating a breakout soon
Recent news regarding Google AI advancements and cloud platform partnerships has generated positive sentiment.
Google's consistent revenue and earnings growth contribute to positive investor sentiment.
Moving averages and RSI suggest potential for further upward momentum.
Slightly positive (65% positive, 35% neutral/negative)
Mixed (48% positive, 42% neutral, 10% negative)
Neutral to Slightly positive (52% positive, 48% neutral)
Recent High-frequency data options trading activity suggests a slight upward bias, potentially indicating cautious optimism.
Mentions of "Google AI" and "Google Cloud" have increased in the past few days, suggesting growing interest but not necessarily widespread positive sentiment.
The Machine Learning Model predicts a 60% probability of a neutral earnings surprise, with a 20% chance of a positive surprise and 20% chance of a negative surprise.

I want to buy more, more and more of Google sharesI hope it would retrace to the 2nd support level at 143.19 so that I can accumulate more.
Approximately, had you invested in this company in 2004 , 20 years ago, you would have made more than 6000% returns, 10 years ago, more than 500%, 5 years ago, more than 200% and 1 year ago, it would be 105% returns.
Imagine if China is willing to open the market for Google to come in and some sort of collaboration on a win-win basis can be established, the market will be phenomenal for Google and also the users in China. Of course, there is the protectionism that each country wants to work with to protect its own market, national security issues, political reasons, etc.
Let's see how it goes ......

GOOG Momentum Long *Potential Setup*This is a potential long on GOOG.
The first leg up has happened which is step one of the setup.
Step two is a tight consolidation channel which I am waiting to see.
Step three would be a second leg up.

Big Tech is nearly at All time High's. Just 3% away!It has doubled since the peak Recession fears of 2021
#BTC has also more than doubled
#SOL has 4 or 5 X'd
This chart is combined price chart of
#Googl
#Appl
#MSFT
#Amzn
#NVDA
#NFLX
#META
U can see the two head and shoulder tops in 2021
and also the inverse head and shoulders in 2022
The clean break and run.
And also the Bull Pennant which has already bullishly triggered 3 weeks ago.
From these levels if that Bull pennant target is to be met (log scale)
It seems this basket has another 30% move left in it.

Resistance and Support"If the direction of the candlestick tends to rise and fall, the price will be at the recommended support and resistance levels."
"Investors should understand the nature of the product, return conditions, and risks before making investment decisions."

This is not an ideal entry point.Some people are looking for cup-and-handle patterns as daily charts. They are not wrong. But they often overlook the duration of the pattern. In short, less than three weeks is too short. These patterns often come back down easily even if they break out like today.
If anyone asks me if this is the ideal time to enter, I will say no.
But I'm not pessimistic about Google.
Google is a good stock, and I think the stock will eventually go up. At least while the market is bullish.
So if you're a long-term investor looking into the distant future, there's probably no problem. Regardless of when you entry.
But if you're an investor looking for higher returns over the medium term using the chart, you probably have a better option.


A beautiful setup is approaching for GOOGL!🔉Sound on!🔉
Thank you as always for watching my videos. I hope that you learned something very educational! Please feel free to like, share, and comment on this post. Remember only risk what you are willing to lose. Trading is very risky but it can change your life!

Alphabet Linear LadderSimple project with potential support and resistance levels projected in time, with the main scenario considering the destination of the blue rectangle in case of some good earnings report after a bearish correction, while the second scenario being about a slow linear climb on the gray ladder levels even before earnings.
The trading idea is only meant to be considered if relevant events and price action (like candlestick patterns or signals) occur coincidently at the marked levels or shapes.
Also in case of a sudden shift in sentiment, the reverse can be regarded as a valid scenario, meaning a bearish mood for the stock, if a retest happens at any of the elements in the project.

$GOOGL still one leg higher? $200+?Judging off of sentiment, I think most people believe that Google will miss earnings.
Based off the chart, I think there's still one leg higher that likely starts on a reaction to earnings.
I think what's likely is we get a retest of support tomorrow and a low into earnings, and then we see a positive reaction after earnings that starts the next leg higher up to $200+.
Top targets are $214-234.
Let's see what happens.

Range LeftWe've fallen below the 1 week old trading range and may face further drops now.
The status is overbought.

Is it a good time to buy Google?It feels like the bottom for Google in the long term.
(1) The price is touching the long term trend line
(2) Fib retracement is at 0.618~0.65 range
(3) WaveTrend touched the bottom
But what if the trend line breaks?
Maybe $64 will stop it or maybe $50.
Always be ready for the worst case scenario.
Don't go all in nor use leverage because you never know the bottom.

Google's Reverse Head and Shoulder patternI looks like Google stock price completed reverse head and shoulder pattern.
We can expect about 30% price raise.

$GOOG Cup and HandleLittle late to the party here but look to enter on pullbacks with clear stop at halfway point on the cup. Love this pattern, shout out William O'Neil

Google Set to Invests 1 Billion Euros in Finnish Data CentreGoogle ( NASDAQ:GOOG ), a subsidiary of Alphabet Inc., has announced its plan to invest an additional 1 billion euros ($1.1 billion) in the expansion of its data center campus in Finland. This strategic move aims to bolster the company's artificial intelligence (AI) business growth in Europe. The Nordic region, with its cooler climate, tax incentives, and abundant renewable energy sources, has become a preferred location for data centers in recent years.
While some Nordic countries have expressed concerns about hosting data centres, citing the potential use of renewable power for higher value products such as green steel, Finland's significant increase in wind power capacity, particularly a 75% surge to 5,677 megawatts in 2022, has positioned it favorably for accommodating data centres. Google ( NASDAQ:GOOG ) has secured wind power in Finland through long-term contracts, leveraging the country's renewable energy potential.
With the proliferation of AI applications, analysts anticipate a substantial surge in data centres' power consumption. Google's investment in the Finnish data centre aligns with its commitment to operating with 97% carbon-free energy and its plan to redirect excess heat from the data centre to the district heating network in Hamina, benefiting local households, schools, and public service buildings. Furthermore, Google has pledged to achieve net zero emissions across all its operations and value chain by 2030.
In addition to its Finnish investment, Google ( NASDAQ:GOOG ) recently announced its intention to construct new data centres in the Netherlands and Belgium. These initiatives underscore the company's strategic focus on expanding its data infrastructure to support its growing AI and cloud computing operations.
Technical Outlook
Google ( NASDAQ:GOOG ) stock is up 1% to $179 per share trading with a bullish Relative Strength Index (RSI) of 71.99 which is sparsely overbought. The stock is prime for further growth as it is trading above the 200, 100, and 50-day Moving Averages (MA) Respectively.
A move further above the 1-month high to the pivot point will validate new highs for Google ( NASDAQ:GOOG ).

GOOG heads up at $160: record high, possible top/pullback spotGoogle finally made new highs.
Just hit a major resistance cluster.
Watching closely here, could turn.
$ 157.95 - 160.24 is immediate resistance.
$ 149.93 - 150.66 is first good support below.
$ 202.23 - 203.89 is next major target above.
========================================

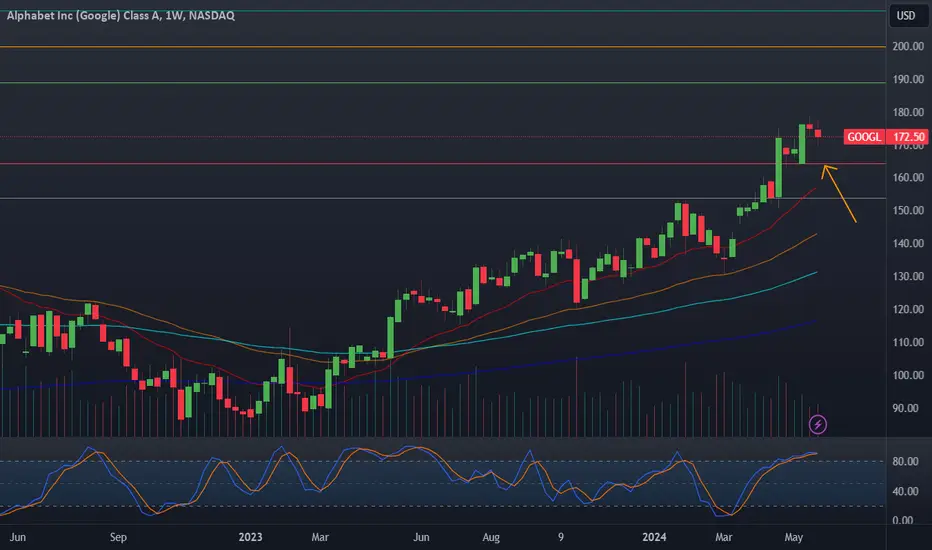
Google Overbought13 of the giant investment companies were on the side that sells googl in this ranks. I'm on the side of the googl area from $ 176 and I think it looks expensive. I can add it if it descends between $ 145 and $ 124. Especially I chase the candles in which the dfr indicator I have developed gives a scholar signal.

