Adobe Inc.
No trades
Key facts today
Next report date
—
Report period
—
EPS estimate
—
Revenue estimate
—
13.80 EUR
5.26 B EUR
20.35 B EUR
417.04 M
About Adobe Inc.
Sector
Industry
CEO
Shantanu Narayen
Website
Headquarters
San Jose
Founded
1982
ISIN
US00724F1012
FIGI
BBG000C2WP64
Adobe, Inc. is a global technology company, which engages in the provision of digital marketing and media solutions. It operates through the following segments: Digital Media, Digital Experience, and Publishing and Advertising. The Digital Media segment offers products and services that enable individuals, teams, businesses, and enterprises to create, publish, and promote content anywhere and accelerate productivity by transforming view, share, engage with and collaborate on documents and creative content. The Digital Experience segment focuses on integrated platform and set of products, services, and solutions that enable businesses to create, manage, execute, measure, monetize, and optimize customer experiences that span from analytics to commerce. The Publishing and Advertising segment includes legacy products and services that address diverse market opportunities, including eLearning solutions, technical document publishing, web conferencing, document and forms platform, web app development, high-end printing, and Adobe Advertising offerings. The company was founded by Charles M. Geschke and John E. Warnock in December 1982 and is headquartered in San Jose, CA.
Related stocks

Adobe Is Down 20%+ YTD. What Its Chart Says Ahead of EarningsAdobe NASDAQ:ADBE plans to release fiscal Q4 results this week at a time when shares of the creative-software giant and former "Cloud King" are down more than 20% year to date. What do ADBE's chart and fundamental analysis say ahead of the report?
Let's take a look:
Adobe's Fundamental Analysis

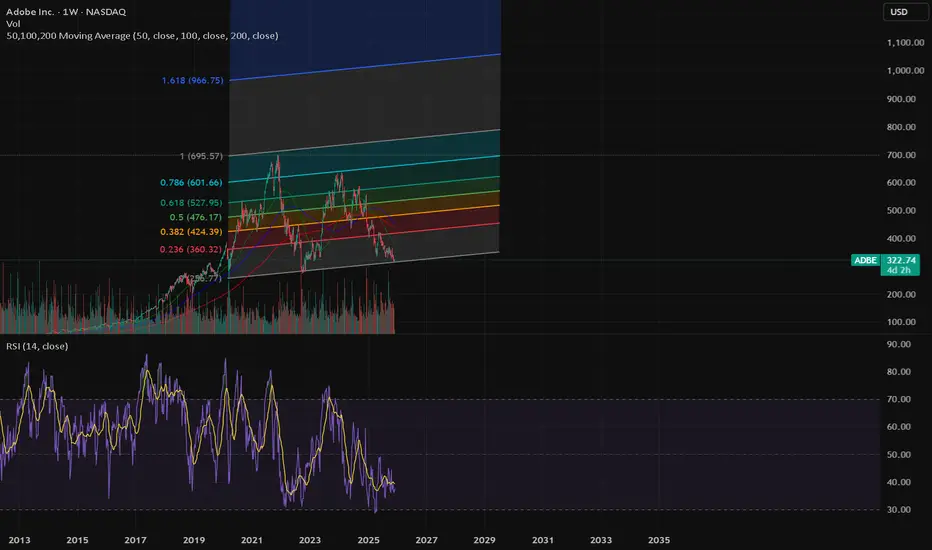
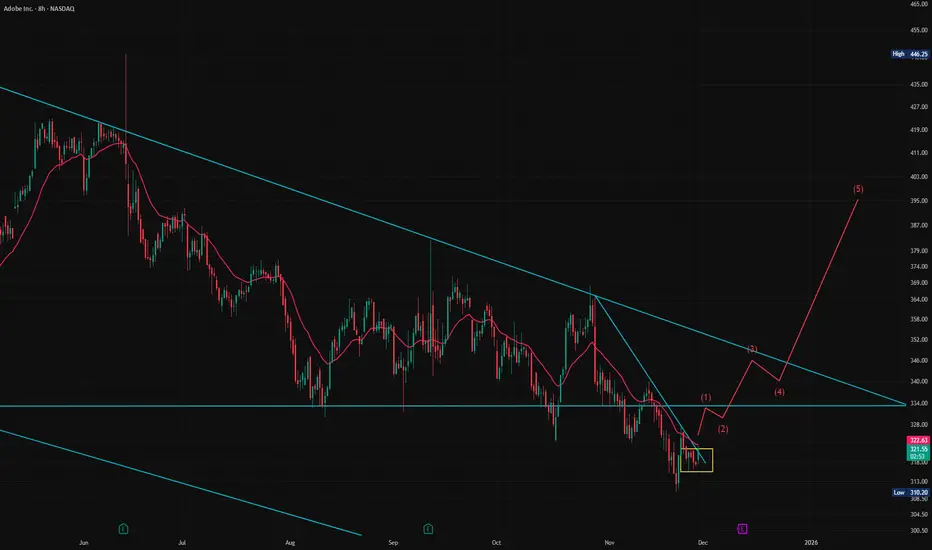
Incoming Years of Sucess?Bullish bat harmonic pattern spotted on the weekly time frame; no confirmation yet, but as soon as it hit the .886 retracement it reacted positively. We can also see that the third leg of the W formation was completed by forming a higher low.

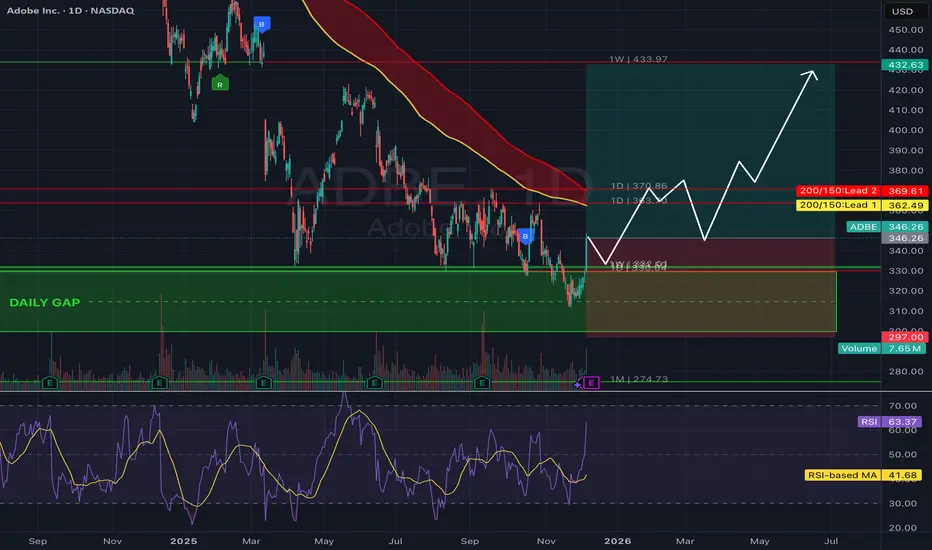
Rendering a ReboundAdobe is currently testing the bottom of a key weekly gap near the $315 level, an important support zone that has historically marked major reversal points. A clean breakout above the $365 level would confirm renewed bullish momentum and open the path toward the $432.63 resistance, which aligns with
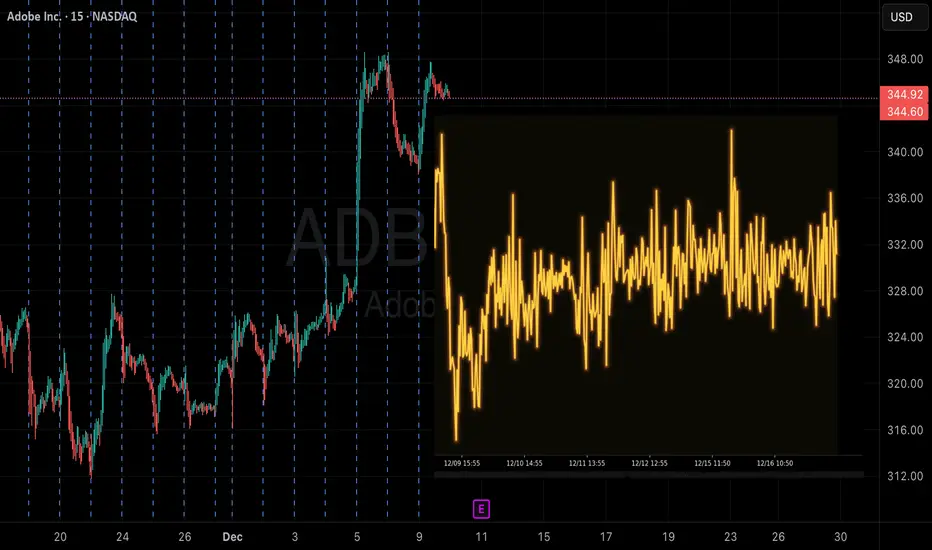
ADBE Pre-Earnings Call Signal — Strong Rally, Elevated Risk📈 ADBE Trading Info — Earnings Signal (2025-12-09)
BUY CALLS
Confidence: 50% (Medium Conviction)
Risk Level: High — Katy conflict detected
🔢 Options Setup
Strike: $347.50
Expiry: 2025-12-12 (3 days)
Entry Range: $11.75 – $12.25 (Mid: $12.00)
Target 1: $18.00
Target 2: $24.00
Stop Loss: $8.40
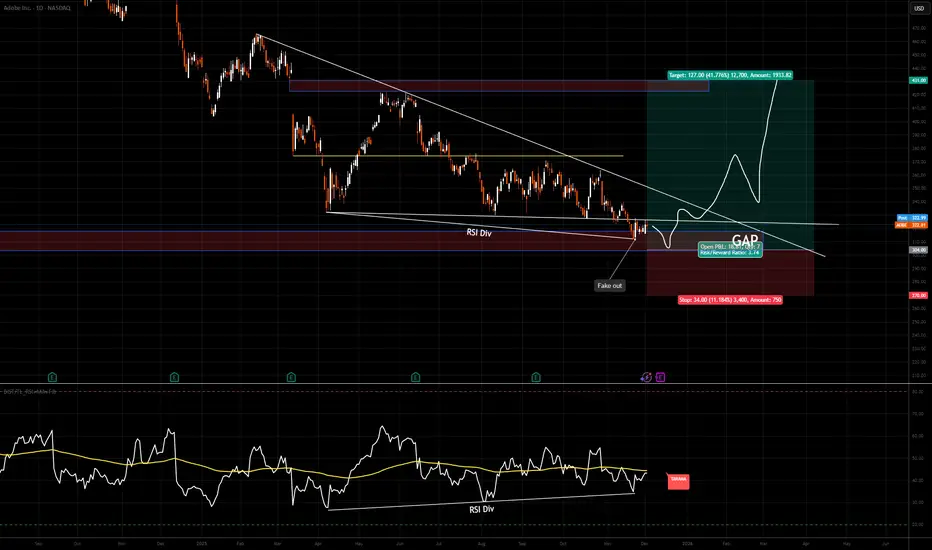
ADBE Fake Out Fill the Gap Descending Wedge PatternI want to start buy from here.
When AI trend end, ADBE will be one of the first stocks that rise.
I'll wait till fill the GAP.
If I'll see "Day Close" above bottom line of the "Descending Wedge Pattern", I'll buy again
My first targe will be GAP at top but I'm expecting more than that.
$ADBE — WEEK 49 TREND REPORT NASDAQ:ADBE — WEEK 49 TREND REPORT
Ticker: NASDAQ:ADBE — 12/02/2025 @ 323$
Timeframe: WEEKLY
This is a reactive structural classification of NASDAQ:ADBE based on the weekly chart as of this timestamp. Price conditions are evaluated as they stand — nothing here is predictive or forw

$adbe Adobe long positionAdobe Inc. (NASDAQ: ADBE), the dominant player in creative software and digital experience solutions, has faced headwinds in 2025, including investor skepticism around AI monetization and competitive pressures from AI-native rivals like Google's Gemini tools. However, as of December 1, 2025, the sto
$ADBE at major supportBought NASDAQ:ADBE
Why?:
- Stretched downtrend
- At major support
- In the next years they will buy back $25 billion in shares.
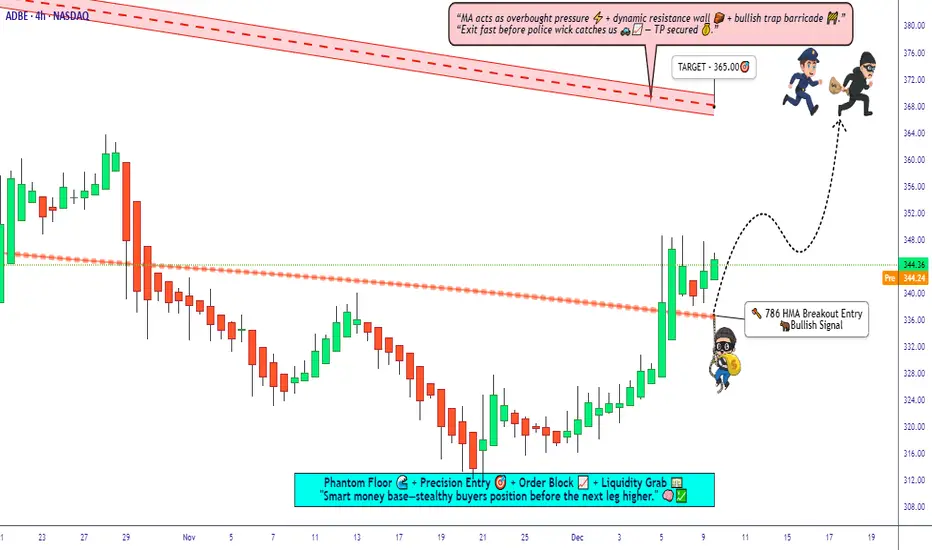
ADBE Setup • HMA ⇧ Breakout with Structured Swing Targets🧨 ADBE – Adobe, Inc. | NASDAQ 🔥 “Stock Market Profit Playbook” (Swing Trade)
HULL Moving Average Breakout • Bullish Momentum Setup 💹😎
**📘 Plan Overview — Bullish Setup Confirmed
The bullish structure is validated by a Hull Moving Average (HMA) breakout, signaling upward momentum building across th
See all ideas
Summarizing what the indicators are suggesting.
Neutral
SellBuy
Strong sellStrong buy
Strong sellSellNeutralBuyStrong buy
Neutral
SellBuy
Strong sellStrong buy
Strong sellSellNeutralBuyStrong buy
Neutral
SellBuy
Strong sellStrong buy
Strong sellSellNeutralBuyStrong buy
An aggregate view of professional's ratings.
Neutral
SellBuy
Strong sellStrong buy
Strong sellSellNeutralBuyStrong buy
Neutral
SellBuy
Strong sellStrong buy
Strong sellSellNeutralBuyStrong buy
Neutral
SellBuy
Strong sellStrong buy
Strong sellSellNeutralBuyStrong buy
Displays a symbol's price movements over previous years to identify recurring trends.
ADBE5981558
Adobe Inc. 5.3% 17-JAN-2035Yield to maturity
4.61%
Maturity date
Jan 17, 2035
ADBE5784629
Adobe Inc. 4.95% 04-APR-2034Yield to maturity
4.50%
Maturity date
Apr 4, 2034
US724PAD1
Adobe Inc. 2.3% 01-FEB-2030Yield to maturity
4.13%
Maturity date
Feb 1, 2030
ADBE5981252
Adobe Inc. 4.95% 17-JAN-2030Yield to maturity
4.10%
Maturity date
Jan 17, 2030
ADBE5784440
Adobe Inc. 4.8% 04-APR-2029Yield to maturity
4.04%
Maturity date
Apr 4, 2029
US724PAC3
Adobe Inc. 2.15% 01-FEB-2027Yield to maturity
3.97%
Maturity date
Feb 1, 2027
ADBE5784439
Adobe Inc. 4.85% 04-APR-2027Yield to maturity
3.85%
Maturity date
Apr 4, 2027
ADBE5981557
Adobe Inc. 4.75% 17-JAN-2028Yield to maturity
3.84%
Maturity date
Jan 17, 2028
See all ADB bonds
Curated watchlists where ADB is featured.


Frequently Asked Questions
The current price of ADB is 295.85 EUR — it has decreased by −0.29% in the past 24 hours. Watch Adobe Inc. stock price performance more closely on the chart.
Depending on the exchange, the stock ticker may vary. For instance, on SWB exchange Adobe Inc. stocks are traded under the ticker ADB.
ADB stock has risen by 6.94% compared to the previous week, the month change is a 2.96% rise, over the last year Adobe Inc. has showed a −42.79% decrease.
We've gathered analysts' opinions on Adobe Inc. future price: according to them, ADB price has a max estimate of 519.94 EUR and a min estimate of 232.04 EUR. Watch ADB chart and read a more detailed Adobe Inc. stock forecast: see what analysts think of Adobe Inc. and suggest that you do with its stocks.
ADB stock is 0.29% volatile and has beta coefficient of 1.18. Track Adobe Inc. stock price on the chart and check out the list of the most volatile stocks — is Adobe Inc. there?
Today Adobe Inc. has the market capitalization of 123.97 B, it has increased by 4.93% over the last week.
Yes, you can track Adobe Inc. financials in yearly and quarterly reports right on TradingView.
Adobe Inc. is going to release the next earnings report on Dec 10, 2025. Keep track of upcoming events with our Earnings Calendar.
ADB earnings for the last quarter are 4.55 EUR per share, whereas the estimation was 4.44 EUR resulting in a 2.41% surprise. The estimated earnings for the next quarter are 4.65 EUR per share. See more details about Adobe Inc. earnings.
Adobe Inc. revenue for the last quarter amounts to 5.13 B EUR, despite the estimated figure of 5.07 B EUR. In the next quarter, revenue is expected to reach 5.27 B EUR.
ADB net income for the last quarter is 1.52 B EUR, while the quarter before that showed 1.49 B EUR of net income which accounts for 1.76% change. Track more Adobe Inc. financial stats to get the full picture.
No, ADB doesn't pay any dividends to its shareholders. But don't worry, we've prepared a list of high-dividend stocks for you.
As of Dec 10, 2025, the company has 30.71 K employees. See our rating of the largest employees — is Adobe Inc. on this list?
EBITDA measures a company's operating performance, its growth signifies an improvement in the efficiency of a company. Adobe Inc. EBITDA is 8.01 B EUR, and current EBITDA margin is 40.74%. See more stats in Adobe Inc. financial statements.
Like other stocks, ADB shares are traded on stock exchanges, e.g. Nasdaq, Nyse, Euronext, and the easiest way to buy them is through an online stock broker. To do this, you need to open an account and follow a broker's procedures, then start trading. You can trade Adobe Inc. stock right from TradingView charts — choose your broker and connect to your account.
Investing in stocks requires a comprehensive research: you should carefully study all the available data, e.g. company's financials, related news, and its technical analysis. So Adobe Inc. technincal analysis shows the neutral today, and its 1 week rating is sell. Since market conditions are prone to changes, it's worth looking a bit further into the future — according to the 1 month rating Adobe Inc. stock shows the sell signal. See more of Adobe Inc. technicals for a more comprehensive analysis.
If you're still not sure, try looking for inspiration in our curated watchlists.
If you're still not sure, try looking for inspiration in our curated watchlists.