Deere & Company (NYSE: $DE) Stock: Q3 Drop After Earnings Deere & Company (NYSE: NYSE:DE ) traded sharply lower after releasing Q3 CY2025 results that showed strong revenue growth but weakening margins and softer forward guidance. The stock closed at $498.13 and dropped more than 5% after market open, falling to $478.78 pre-market. Management cut full-yea
Deere & Company
No trades
Next report date
—
Report period
—
EPS estimate
—
Revenue estimate
—
16.1 EUR
4.36 B EUR
39.55 B EUR
250.96 M
About Deere & Company
Sector
CEO
John C. May
Website
Headquarters
Moline
Founded
1837
IPO date
Jun 29, 1933
Identifiers
3
ISIN US2441991054
Deere & Co. engages in the manufacture and distribution of equipment used in agriculture, construction, forestry, and turf care. It operates through the following segments: Agriculture and Turf, Construction and Forestry, and Financial Services. The Agriculture and Turf segment focuses on the distribution and manufacture of a full line of agriculture and turf equipment and related service parts. The Construction and Forestry segment offers machines and service parts used in construction, earthmoving, road building, material handling and timber harvesting. The Financial Services segment finances sales and leases by John Deere dealers of new and used agriculture and turf equipment and construction and forestry equipment. The company was founded by John Deere in 1837 and is headquartered in Moline, IL.
Related stocks

DE Deere & Company Options Ahead of EarningsAnalyzing the options chain and the chart patterns of DE Deere & Company prior to the earnings report this week,
I would consider purchasing the 510usd strike price Calls with
an expiration date of 2025-12-19,
for a premium of approximately $8.95.
If these options prove to be profitable prior to the

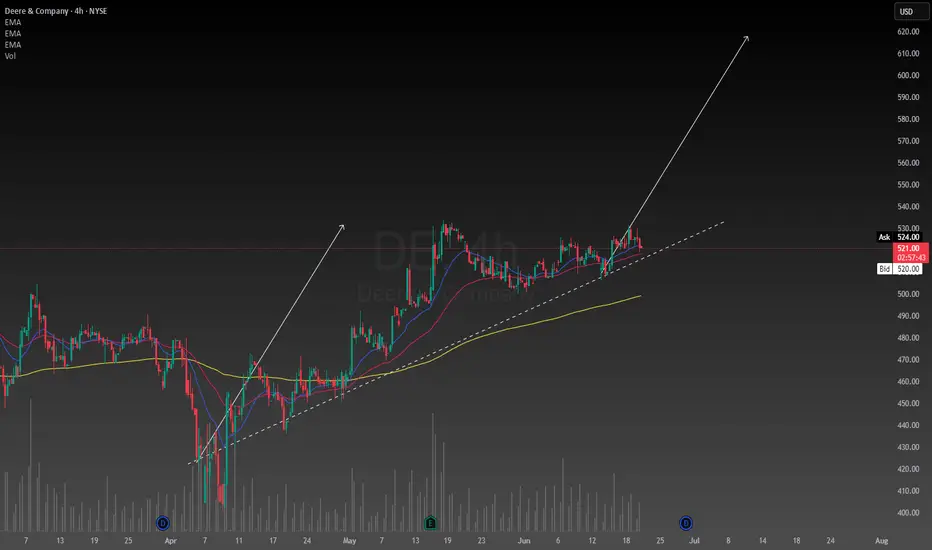
DE - Hopping to the top=======
Volume
=======
- neutral
==========
Price Action
==========
- supported on uptrend line
=================
Technical Indicators
=================
- Ichimoku
>>> price below cloud, approaching cloud
>>> Red kumo contracting slightly
>>> Tenken - Below clouds & turning up
>>> Chiku - Bel

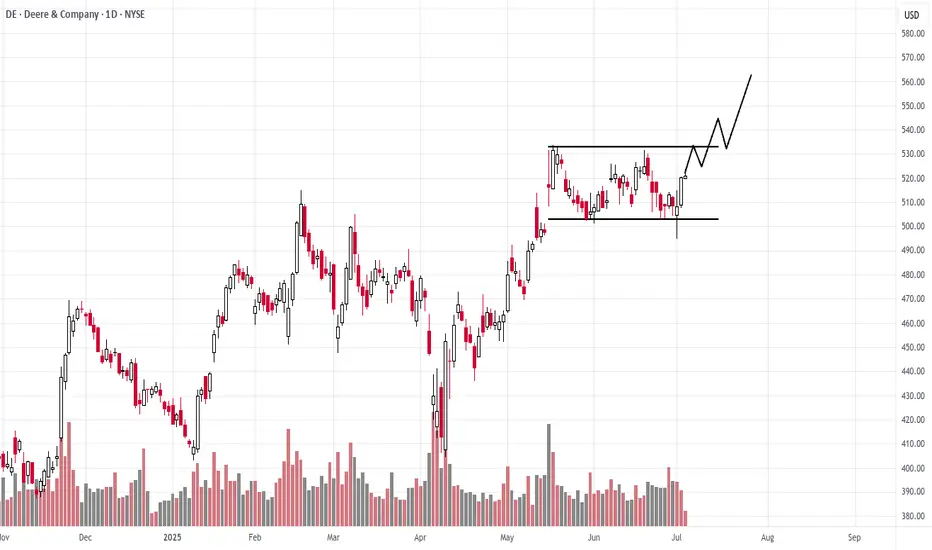
the wedge pattern breakout near ATHStock is outperforming the index and trading near its all-time high and forming a small wedge pattern, indicating consolidation before a potential breakout. A sustained move above $507.50 could trigger bullish momentum. Targeting $553 in the near term. Risk-reward remains favorable with strong price
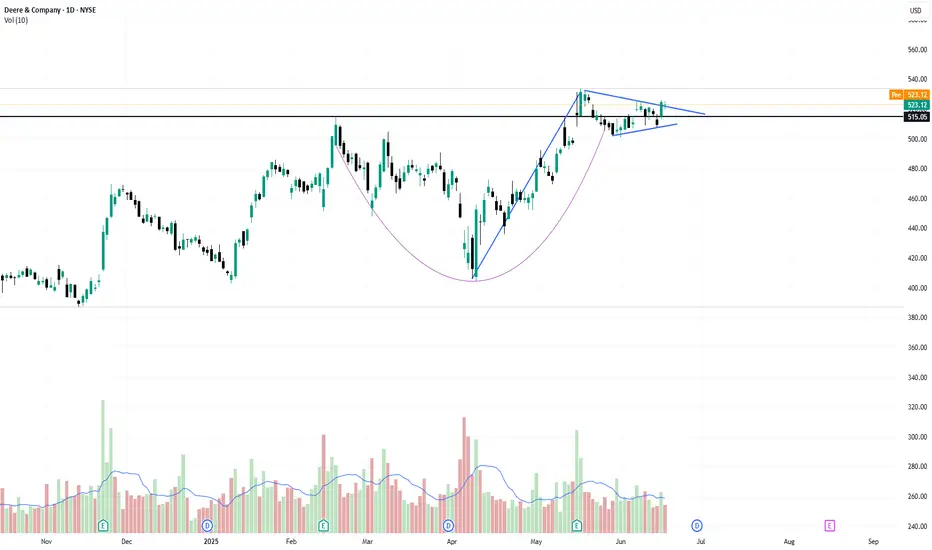
Deere and Company is a stapleIt looks like a good time to buy Deere shares, I have done an evaluation on the perceived intrinsic value of the company. To back up my philosophy about what I think a "good deal" on the shares is, I have included a technical analysis including a trendline being touched for the third time at a measu

Deere May Be LimpingDeere made a new record high in May, but some traders may think the strength is fading.
The first pattern on today’s chart is the three-month range between roughly $495 and $530. It was slightly above an earlier peak from February. DE’s inability to hold that breakout could be viewed as evidence of

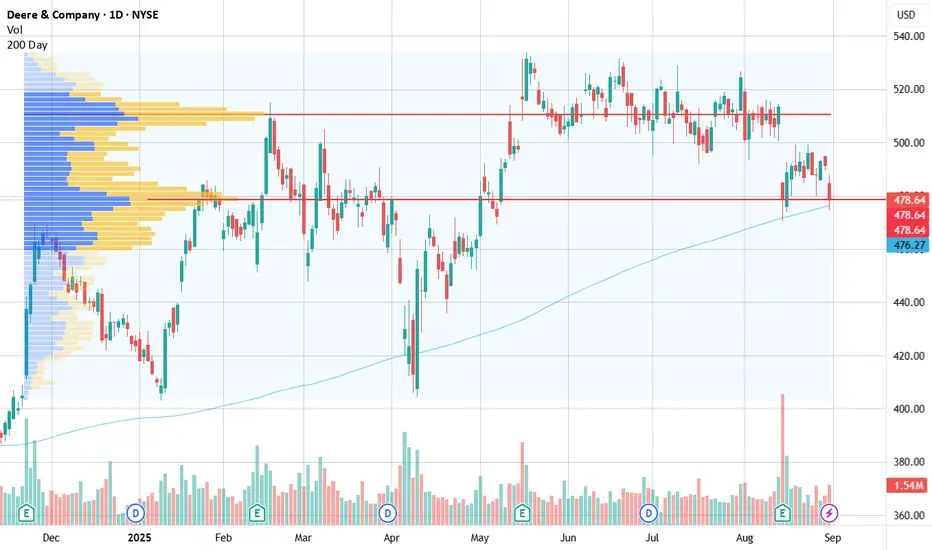
DE and it Potential Fall in PriceDE touched its 200 SMA on 08/14 and 08/29. It is also sitting on its volume profile node at $478.64. Momentum could swing this stock price down and fast
Deere and CompanyNYSE:DE has broken out of a multi-year trading range and is now testing. Possible reaccumulation if we see a strong break through resistance and a test on low volume.
John Deere position trade setupI have been wanting an excuse to add this to my portfolio for a while now. Primarily because Bill Gates has it in his portfolio. I like to try and copy the most successful investors like Warren Buffett, Cathy Wood, Bill Gates, etc... I paid the market price today for a position with a cost average o
$DE DivergenceOn the monthly chart we see a massive bearish divergence on the movement of NYSE:DE and the squeeze indicator below. Keep in mind, this is a monthly chart, which means you have to remain patient.
Not financial advice, good luck to all

See all ideas
Summarizing what the indicators are suggesting.
Neutral
SellBuy
Strong sellStrong buy
Strong sellSellNeutralBuyStrong buy
Neutral
SellBuy
Strong sellStrong buy
Strong sellSellNeutralBuyStrong buy
Neutral
SellBuy
Strong sellStrong buy
Strong sellSellNeutralBuyStrong buy
An aggregate view of professional's ratings.
Neutral
SellBuy
Strong sellStrong buy
Strong sellSellNeutralBuyStrong buy
Neutral
SellBuy
Strong sellStrong buy
Strong sellSellNeutralBuyStrong buy
Neutral
SellBuy
Strong sellStrong buy
Strong sellSellNeutralBuyStrong buy
Displays a symbol's price movements over previous years to identify recurring trends.
J
HJCJC
John Deere Credit Compania Financiera SA 8.5% 25-JUL-2027Yield to maturity
8.13%
Maturity date
Jul 25, 2027
J
HJCHD
John Deere Credit Compania Financiera SA 7.0% 17-JAN-2028Yield to maturity
5.95%
Maturity date
Jan 17, 2028
J
HJCFD
John Deere Credit Compania Financiera SA 5.0% 21-OCT-2026Yield to maturity
5.74%
Maturity date
Oct 21, 2026
J
HJCGD
John Deere Credit Compania Financiera SA 6.5% 21-OCT-2028Yield to maturity
5.71%
Maturity date
Oct 21, 2028
J
AU3CB031081
John Deere Financial Ltd. 5.05% 28-JUN-2029Yield to maturity
5.15%
Maturity date
Jun 28, 2029
J
AU3CB032325
John Deere Financial Ltd. 4.45% 21-JUN-2030Yield to maturity
5.10%
Maturity date
Jun 21, 2030
See all DCO bonds
Frequently Asked Questions
The current price of DCO is 506.6 EUR — it has increased by 0.48% in the past 24 hours. Watch Deere & Company stock price performance more closely on the chart.
Depending on the exchange, the stock ticker may vary. For instance, on SWB exchange Deere & Company stocks are traded under the ticker DCO.
DCO stock has risen by 5.99% compared to the previous week, the month change is a 17.80% rise, over the last year Deere & Company has showed a 11.05% increase.
We've gathered analysts' opinions on Deere & Company future price: according to them, DCO price has a max estimate of 610.81 EUR and a min estimate of 385.87 EUR. Watch DCO chart and read a more detailed Deere & Company stock forecast: see what analysts think of Deere & Company and suggest that you do with its stocks.
DCO stock is 2.45% volatile and has beta coefficient of 0.64. Track Deere & Company stock price on the chart and check out the list of the most volatile stocks — is Deere & Company there?
Today Deere & Company has the market capitalization of 137.69 B, it has increased by 6.58% over the last week.
Yes, you can track Deere & Company financials in yearly and quarterly reports right on TradingView.
Deere & Company is going to release the next earnings report on Feb 19, 2026. Keep track of upcoming events with our Earnings Calendar.
DCO earnings for the last quarter are 3.41 EUR per share, whereas the estimation was 3.33 EUR resulting in a 2.26% surprise. The estimated earnings for the next quarter are 1.71 EUR per share. See more details about Deere & Company earnings.
Deere & Company revenue for the last quarter amounts to 9.17 B EUR, despite the estimated figure of 8.52 B EUR. In the next quarter, revenue is expected to reach 6.40 B EUR.
DCO net income for the last quarter is 923.10 M EUR, while the quarter before that showed 1.13 B EUR of net income which accounts for −18.25% change. Track more Deere & Company financial stats to get the full picture.
Yes, DCO dividends are paid quarterly. The last dividend per share was 1.38 EUR. As of today, Dividend Yield (TTM)% is 1.07%. Tracking Deere & Company dividends might help you take more informed decisions.
Deere & Company dividend yield was 1.40% in 2025, and payout ratio reached 35.02%. The year before the numbers were 1.44% and 22.95% correspondingly. See high-dividend stocks and find more opportunities for your portfolio.
As of Feb 15, 2026, the company has 73.1 K employees. See our rating of the largest employees — is Deere & Company on this list?
EBITDA measures a company's operating performance, its growth signifies an improvement in the efficiency of a company. Deere & Company EBITDA is 10.21 B EUR, and current EBITDA margin is 25.11%. See more stats in Deere & Company financial statements.
Like other stocks, DCO shares are traded on stock exchanges, e.g. Nasdaq, Nyse, Euronext, and the easiest way to buy them is through an online stock broker. To do this, you need to open an account and follow a broker's procedures, then start trading. You can trade Deere & Company stock right from TradingView charts — choose your broker and connect to your account.
Investing in stocks requires a comprehensive research: you should carefully study all the available data, e.g. company's financials, related news, and its technical analysis. So Deere & Company technincal analysis shows the buy rating today, and its 1 week rating is strong buy. Since market conditions are prone to changes, it's worth looking a bit further into the future — according to the 1 month rating Deere & Company stock shows the strong buy signal. See more of Deere & Company technicals for a more comprehensive analysis.
If you're still not sure, try looking for inspiration in our curated watchlists.
If you're still not sure, try looking for inspiration in our curated watchlists.