If you are crazy about volume trading U "Must" C Enphase Energy"Volume trading is an analysis method that uses trading volume—the number of units of an asset traded over a specific period—to understand market activity and predict future price movements. By comparing volume to price, traders can gauge the strength of a trend, with high volume confirming a trend
Next report date
—
Report period
—
EPS estimate
—
Revenue estimate
—
1.265 EUR
99.17 M EUR
1.29 B EUR
125.87 M
About Enphase Energy, Inc.
Sector
Industry
CEO
Badrinarayanan Kothandaraman
Website
Headquarters
Fremont
Founded
2006
ISIN
US29355A1079
FIGI
BBG002VN77D3
Enphase Energy, Inc. is a global energy technology company, which engages in the business of designing, developing, manufacturing, and selling home energy solutions that manage energy generation, energy storage, control, and communications on one intelligent platform. It operates through the following geographical segments: the United States, the Netherlands, and Others. The company was founded by Raghuveer R. Belur and Martin Fornage in March 2006 and is headquartered in Fremont, CA.
Related stocks

ENPH update swing long.While the previous swing long setup gave a bounce of around 28% price have now retraced back to the entry zone. Few setups to look for here. Liquidity grab of the previous low sitting at 29.89. The HTF negative 618 sitting at 28.5. However for sign of strength ENPH needs to close monthly candle abov
Enphase Energy Chart Fibonacci Analysis 092625Trading Idea
1) Find a FIBO slingshot
2) Check FIBO 61.80% level
3) Entry Point > 36.3/61.80%
Chart time frame:B
A) 15 min(1W-3M)
B) 1 hr(3M-6M)
C) 4 hr(6M-1year)
D) 1 day(1-3years)
Stock progress:A
A) Keep rising over 61.80% resistance
B) 61.80% resistance
C) 61.80% support
D) Hit the bottom
E

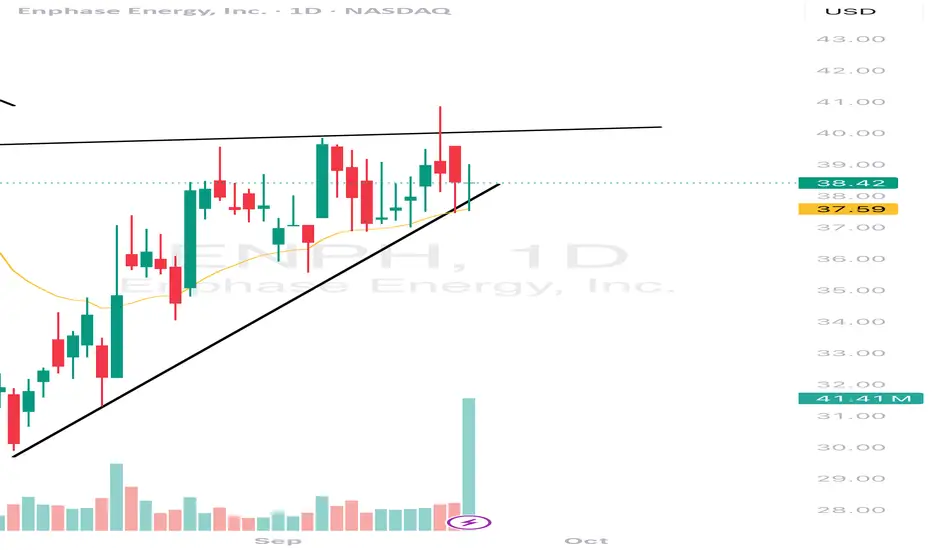
ENPH - potential ascending triangle breakout hereENPH- stock forming an ascending triangle pattern on the daily with huge volume candle on Friday. Possible breakout move here if $40 breaks for a move towards $50 and higher. On high watch.
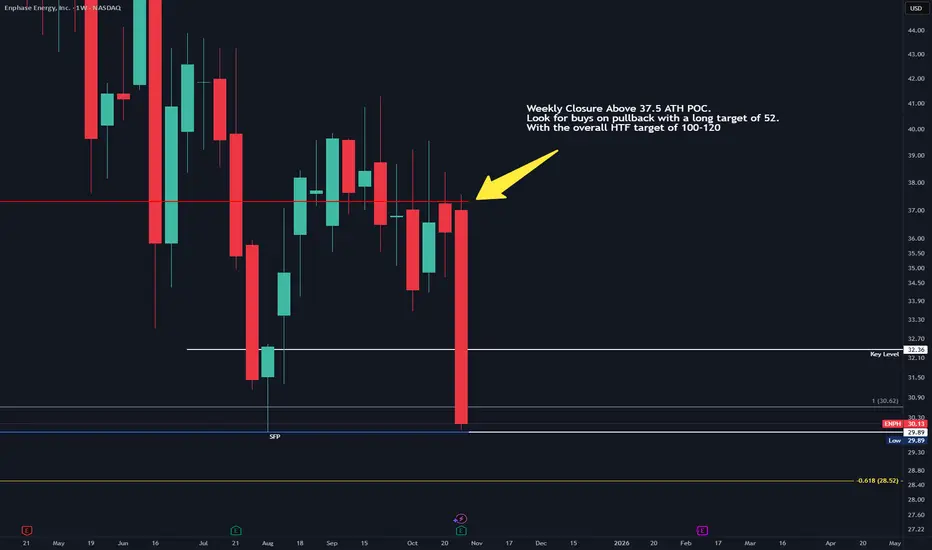
Enphase potential swing long zoneWe have a little zone of confluence. With the 0.382 macro retracement from ATL/ATL stacking with the 1 to 1 fib trend from ATL coming in around 32. You have have monthly level and the pyschological 30 level. 1 way to approach the long would be to see price go below previous low/key level and look fo

Started a position on this ticker at $30Started a position on this ticker at $30 because of the bullish divergence happening with MacD//Price. planning on holding my leap contacts and if price drops back to $30 ill (DCA)
$enphyieahh,
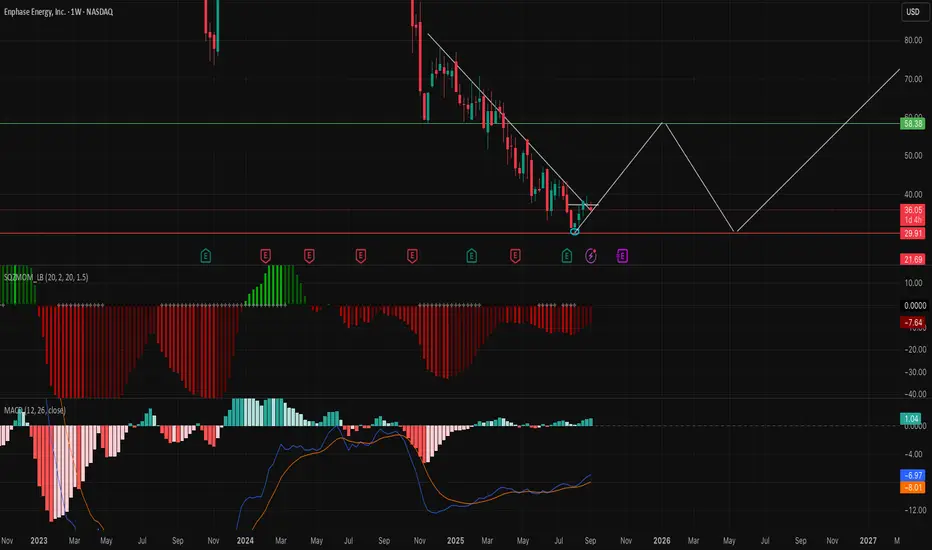
logaritmic monthly chart. This one indeed has the uptrend posiiblities with this month's bounce at the bottom of the channel.
$6k target price is too much - but will play this one to aim a $120 ish price.
Good volume similar to the previous one that eventually bounced price out of the mid

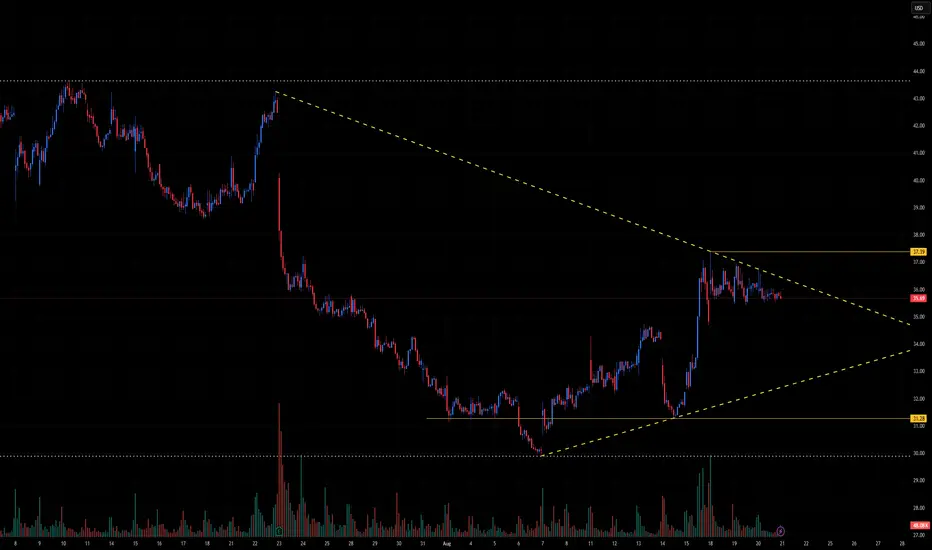
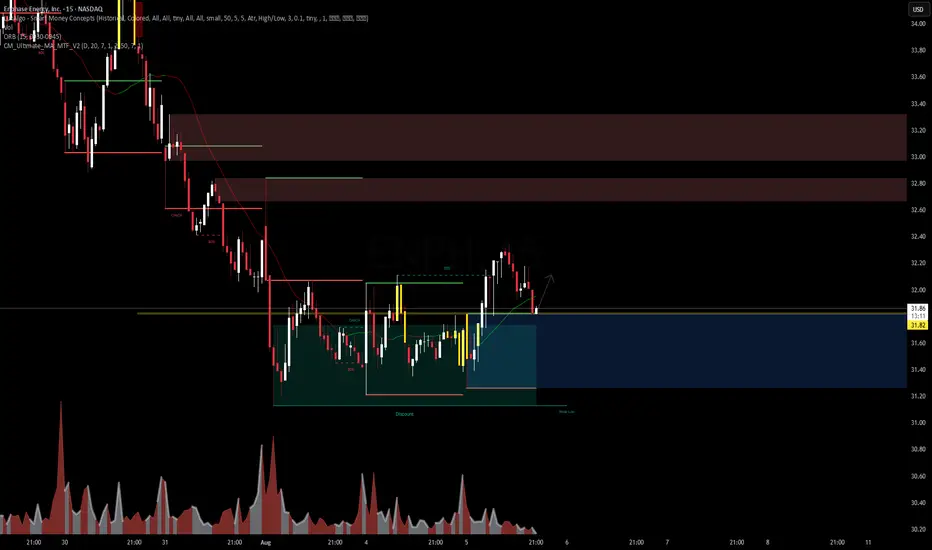
ENPH Technical Outlook – Symmetrical Triangle at Decision Point⚡ ENPH Technical Outlook – Symmetrical Triangle at Decision Point
Ticker: ENPH (Enphase Energy)
Timeframe: 30-minute candles
🔍 Current Setup
ENPH is consolidating within a symmetrical triangle pattern, marked by a series of lower highs and higher lows. This compression indicates indecision, with
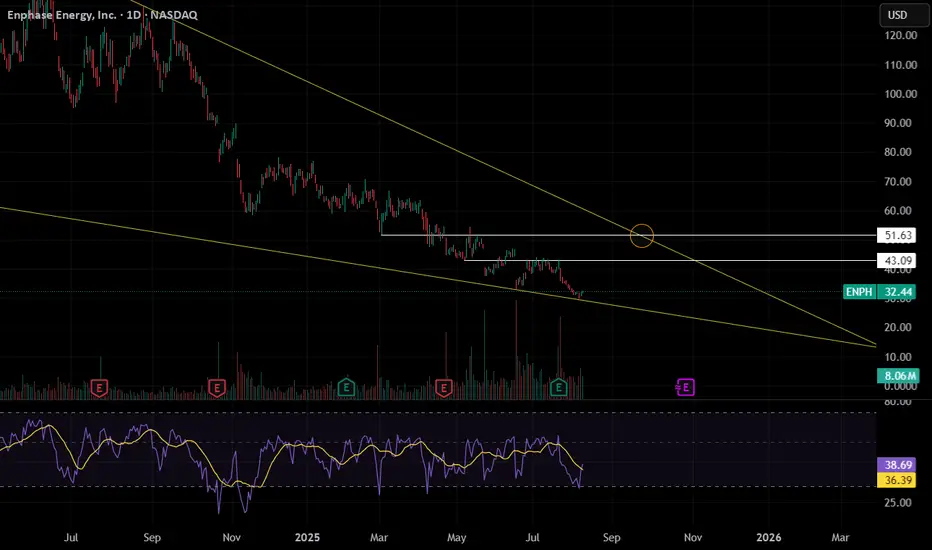
ENPH - Falling Wedge, Possible upward + 80% ENPH is forming a falling-wedge pattern accompanied by rising volume.
The first target is 43.09 — it needs to be cleared with strong volume to validate the move — then the next target is near 51.
I’ll post updated targets after it breaks and holds above 51.
Stop loss: if price begins trading belo
ENPH, At the base support. Entering position for intra-daytrade. I think they did a liquidity sweep there, but the price should mean-reverse if I am correct.
See all ideas
Summarizing what the indicators are suggesting.
Neutral
SellBuy
Strong sellStrong buy
Strong sellSellNeutralBuyStrong buy
Neutral
SellBuy
Strong sellStrong buy
Strong sellSellNeutralBuyStrong buy
Neutral
SellBuy
Strong sellStrong buy
Strong sellSellNeutralBuyStrong buy
An aggregate view of professional's ratings.
Neutral
SellBuy
Strong sellStrong buy
Strong sellSellNeutralBuyStrong buy
Neutral
SellBuy
Strong sellStrong buy
Strong sellSellNeutralBuyStrong buy
Neutral
SellBuy
Strong sellStrong buy
Strong sellSellNeutralBuyStrong buy
Displays a symbol's price movements over previous years to identify recurring trends.
ENPH5139638
Enphase Energy, Inc. 0.0% 01-MAR-2026Yield to maturity
—
Maturity date
Mar 1, 2026
ENPH5139644
Enphase Energy, Inc. 0.0% 01-MAR-2028Yield to maturity
—
Maturity date
Mar 1, 2028
See all E0P bonds
INRA
iShares Global Clean Energy Transition UCITS ETF Accum Shs USDWeight
1.66%
Market value
48.95 M
USD
Explore more ETFs
Curated watchlists where E0P is featured.

Frequently Asked Questions
The current price of E0P is 23.290 EUR — it has increased by 3.01% in the past 24 hours. Watch Enphase Energy, Inc. stock price performance more closely on the chart.
Depending on the exchange, the stock ticker may vary. For instance, on SWB exchange Enphase Energy, Inc. stocks are traded under the ticker E0P.
E0P stock has fallen by −6.32% compared to the previous week, the month change is a −24.30% fall, over the last year Enphase Energy, Inc. has showed a −61.57% decrease.
We've gathered analysts' opinions on Enphase Energy, Inc. future price: according to them, E0P price has a max estimate of 57.67 EUR and a min estimate of 20.22 EUR. Watch E0P chart and read a more detailed Enphase Energy, Inc. stock forecast: see what analysts think of Enphase Energy, Inc. and suggest that you do with its stocks.
E0P stock is 4.27% volatile and has beta coefficient of 0.51. Track Enphase Energy, Inc. stock price on the chart and check out the list of the most volatile stocks — is Enphase Energy, Inc. there?
Today Enphase Energy, Inc. has the market capitalization of 3.06 B, it has decreased by −4.88% over the last week.
Yes, you can track Enphase Energy, Inc. financials in yearly and quarterly reports right on TradingView.
Enphase Energy, Inc. is going to release the next earnings report on Feb 10, 2026. Keep track of upcoming events with our Earnings Calendar.
E0P earnings for the last quarter are 0.77 EUR per share, whereas the estimation was 0.56 EUR resulting in a 37.64% surprise. The estimated earnings for the next quarter are 0.51 EUR per share. See more details about Enphase Energy, Inc. earnings.
Enphase Energy, Inc. revenue for the last quarter amounts to 349.76 M EUR, despite the estimated figure of 314.70 M EUR. In the next quarter, revenue is expected to reach 298.77 M EUR.
E0P net income for the last quarter is 56.79 M EUR, while the quarter before that showed 31.45 M EUR of net income which accounts for 80.55% change. Track more Enphase Energy, Inc. financial stats to get the full picture.
No, E0P doesn't pay any dividends to its shareholders. But don't worry, we've prepared a list of high-dividend stocks for you.
As of Nov 24, 2025, the company has 2.78 K employees. See our rating of the largest employees — is Enphase Energy, Inc. on this list?
EBITDA measures a company's operating performance, its growth signifies an improvement in the efficiency of a company. Enphase Energy, Inc. EBITDA is 245.39 M EUR, and current EBITDA margin is 12.37%. See more stats in Enphase Energy, Inc. financial statements.
Like other stocks, E0P shares are traded on stock exchanges, e.g. Nasdaq, Nyse, Euronext, and the easiest way to buy them is through an online stock broker. To do this, you need to open an account and follow a broker's procedures, then start trading. You can trade Enphase Energy, Inc. stock right from TradingView charts — choose your broker and connect to your account.
Investing in stocks requires a comprehensive research: you should carefully study all the available data, e.g. company's financials, related news, and its technical analysis. So Enphase Energy, Inc. technincal analysis shows the sell today, and its 1 week rating is sell. Since market conditions are prone to changes, it's worth looking a bit further into the future — according to the 1 month rating Enphase Energy, Inc. stock shows the strong sell signal. See more of Enphase Energy, Inc. technicals for a more comprehensive analysis.
If you're still not sure, try looking for inspiration in our curated watchlists.
If you're still not sure, try looking for inspiration in our curated watchlists.