S50U2022 trade ideas

S50Z2020 Highest Close Since Early JuneS50 stopped at an interesting place this Friday, at a secondary falling resistance and support, I just love when the price knows the technical game book.
Since the pennant pattern was broken, the volume speaks for an absence of interest and the probability for a false breakout is higher.
Even so, will S50’s lack of interest still takes it a bit higher, to start and consolidate around the 970 resistance and support. And from there, start to show some interest with higher highs and higher lows or will the air leak out and testing the support and resistance area, somewhere around 850-900?
Since the market sentiment, last month or so, is mostly driven by Covid vaccination news, and any “old”-normal it can bring back to us, so will any news come to push S50 –and the broader market— in any direction, or is it time for the market itself to show any strength/weakness?
Before I’ll end this analysis, I have to mention SET and that it is playing tricks with its bigger brother, the SET50 and the its connected futures that I am analyzing today.
So will SET continue to be wearing the leader jacket or will the close, it did on the resistance at 1450 act like a BIG stop sign?!


S50Z20 Set 50 Dec 20 Path Plan 12-20 NovHigh Volumes in last few days and a lot of Options churning , Neutral path for now Resistance 905.0 Support 850.0 for now. Short below 870.0 for 840.0 Stop 875.0 and Long above 880.0 For 905 Stop 875.0 Hedge with selling Options.

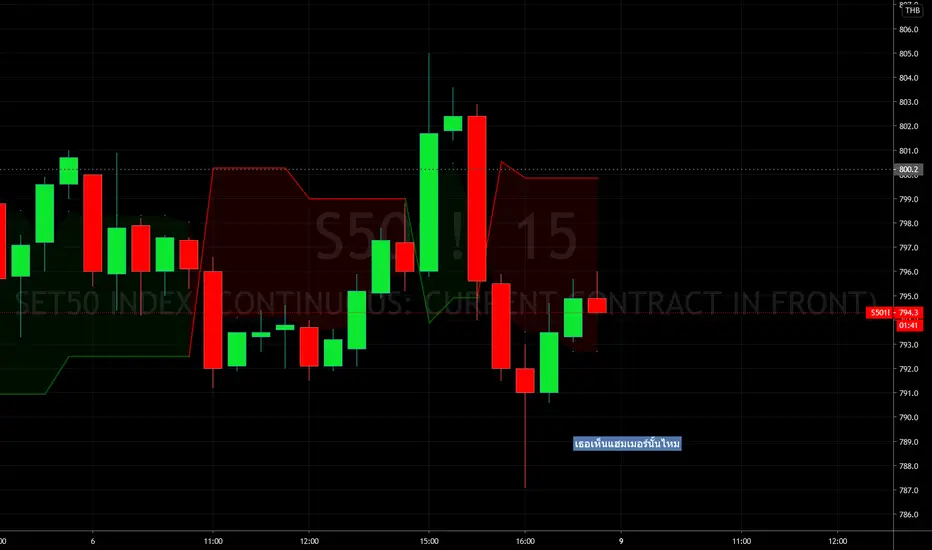

S50Z2020 - Daily analysis on 9-10-2020- Daily Timeframe is downtrend
- H4 Timeframe is sideway; try to form higher high
- H1 Timeframe is sideway; try to from higher high. If price don't close below 787, trend reversal in H1
- 15 minute is sideway in uptrend. Trading channel is 800 - 809. If price isn't below 795, It's still stay in uptrend.

S50Z2020 - Daily analysis on 7-10-2020Daily Chart
- Trading channel is 787-777
- Green doji was shown on price chart means sideway on yesterday.
- There is a chance to reach 787.
- Downtrend on daily chart
H1 Chart
- Cluster of candle stick was stuck under supply zone.
- This is a zone for collecting short position.
- Downtrend on Hourly chart.
* Bias Short


S50Z2020 - Daily analysis on 2-10-2020Daily chart
- Trading channel is 777.4 - 800.0
- A candle stick similar to hammer was shown on price chart at support area yesterday mean short term rebound.
- Downtrend in daily chart
Hourly chart
- Trading channel is 774.4 -787.5
- If price across 787.5, high chance to reach 793.
* Bias Short (belong to daily chart show downtrend.
* Rebound and Short strategy today.

S50Z2020 - Daily analysis on 29-9-2020For daily chart
- Trading channel is 777.6 - 801.5
- Bullish reversal candle stick pattern (morning star) was formed on daily chart, but it must be confirmed by today.
- Now, It's downtrend.
For 60 min chart
- Close price is 796.0
- High chance to reach 800 then throwback
- If price throwback isn't less than 788, that's mean price reversal on 60 min chart.
Strategy : Wait and see

S50Z2020 - Daily analysis on 28-9-2020Trading channel is 777 -790
- Candle sticks are at resistance zone.
- Bias short
- Wait and see strategy today


S50Z2020 - Daily analysis on 25-9-2020- Trading channel is 777 -790
- Doji show on daily chart yesterday
- High chance on technical rebound today
- Bias short
- Wait and see strategy today


S50Z2020 - Daily analysis on 24-9-2020- Trading channel is 790 - 805 but at 800 must be concern.
- Looking back on price chart, this zone is choppy market. It's hard for scalping trade.
- Bias short

S50Z2020 - Daily analysis on 21-9-2020- Trading channel is 814 - 831
- Reversal candle stick appeared on daily chart
- Price came back to test 819 and could be stand
- In 60 min chart, big white candle stick with volume shown on a chart.
- Bias Long target is 831, the next target is 842.

S50Z2020 - Daily analysis on 11-9-2020Daily time frame : Downtrend
Channel trading price : 816 - 830
- follow the same plan as yesterday
- If price stand at 830 in 60 min chart, price can be reach at 844.
- If price can't pass 830 Bias Short!
Please calculate RR ratio before open any position.

S50Z2020 - Daily analysis on 10-9-2020Daily time frame : Downtrend
Channel trading price : 816 - 830
- If price stand at 830 in 60 min chart, price can be reach at 844.
- If price can't pass 830 Bias Short!
Please calculate RR ratio before open any position.

Setup to short SET50 Looks like happy days are over, with lower highs and lower lows. SinceTuesday's Engulfing Candle didn't do much.
So here is my setup, if my Put is triggered


