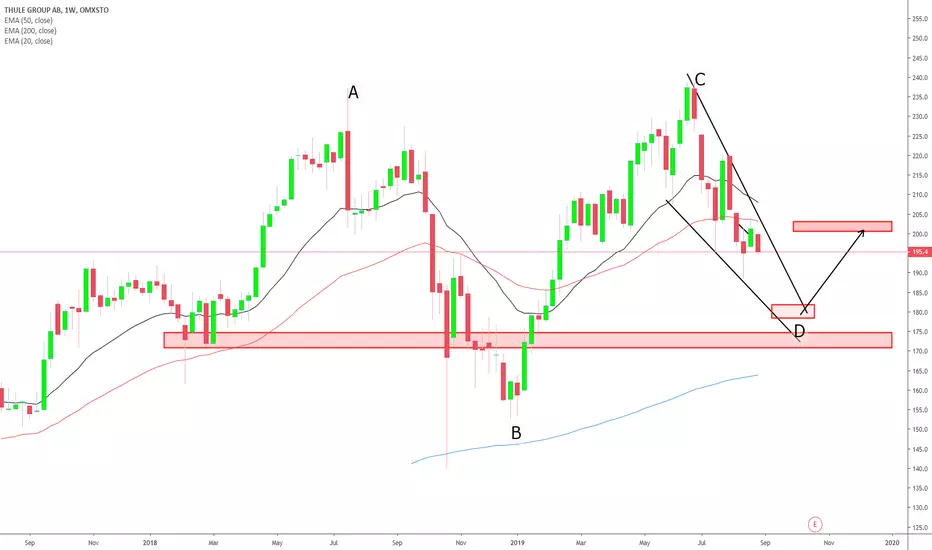
THULE LOOKING FOR SUPPORTThule had a big grow in the last years. i was traveling around Canada and USA and I noticed a lot of Thule Tools everywhere. i checked at TV and bam bullish Chart.
On the Long time we are in a consolidatio or reversal Situation. I expect a rebound around 170-180 Dollars. Buyers are there. The targe
Thule Group AB
No trades
Next report date
—
Report period
—
EPS estimate
—
Revenue estimate
—
1.12 USD
120.53 M USD
1.13 B USD
107.56 M
About Thule Group AB
Sector
Industry
CEO
Mattias Ankarberg
Website
Headquarters
Malmö
Founded
2008
IPO date
Nov 26, 2014
Identifiers
2
ISIN SE0006422390
Thule Group AB is a holding company that engages in the manufacture of sports and outdoor products. The company was founded in 1942 and is headquartered in Malmö, Sweden.
Related stocks
Summarizing what the indicators are suggesting.
Neutral
SellBuy
Strong sellStrong buy
Strong sellSellNeutralBuyStrong buy
Neutral
SellBuy
Strong sellStrong buy
Strong sellSellNeutralBuyStrong buy
Neutral
SellBuy
Strong sellStrong buy
Strong sellSellNeutralBuyStrong buy
An aggregate view of professional's ratings.
Neutral
SellBuy
Strong sellStrong buy
Strong sellSellNeutralBuyStrong buy
Neutral
SellBuy
Strong sellStrong buy
Strong sellSellNeutralBuyStrong buy
Neutral
SellBuy
Strong sellStrong buy
Strong sellSellNeutralBuyStrong buy
Displays a symbol's price movements over previous years to identify recurring trends.
MEUH
Amundi Core Stoxx Europe 600 -UCITS ETF HEDGED- CapitalisationWeight
0.03%
Market value
5.04 M
USD
STXH
Amundi Index Solutions SICAV - Amundi Core Stoxx Europe 600 UCITS ETF Monthly Hedged to EUR - Dist- DistributionWeight
0.03%
Market value
5.04 M
USD
Explore more ETFs
Frequently Asked Questions
The current price of THLPF is 26.82 USD — it has decreased by −8.15% in the past 24 hours. Watch Thule Group AB stock price performance more closely on the chart.
Depending on the exchange, the stock ticker may vary. For instance, on OTC exchange Thule Group AB stocks are traded under the ticker THLPF.
THLPF stock has fallen by −8.15% compared to the previous week, the month change is a −8.15% fall, over the last year Thule Group AB has showed a −6.25% decrease.
We've gathered analysts' opinions on Thule Group AB future price: according to them, THLPF price has a max estimate of 33.63 USD and a min estimate of 24.66 USD. Watch THLPF chart and read a more detailed Thule Group AB stock forecast: see what analysts think of Thule Group AB and suggest that you do with its stocks.
THLPF reached its all-time high on Aug 31, 2021 with the price of 54.25 USD, and its all-time low was 11.98 USD and was reached on Jul 27, 2015. View more price dynamics on THLPF chart.
See other stocks reaching their highest and lowest prices.
See other stocks reaching their highest and lowest prices.
THLPF stock is 8.87% volatile and has beta coefficient of 1.27. Track Thule Group AB stock price on the chart and check out the list of the most volatile stocks — is Thule Group AB there?
Today Thule Group AB has the market capitalization of 2.78 B, it has increased by 1.50% over the last week.
Yes, you can track Thule Group AB financials in yearly and quarterly reports right on TradingView.
Thule Group AB is going to release the next earnings report on Apr 29, 2026. Keep track of upcoming events with our Earnings Calendar.
THLPF earnings for the last quarter are 0.02 USD per share, whereas the estimation was 0.04 USD resulting in a −39.83% surprise. The estimated earnings for the next quarter are 0.31 USD per share. See more details about Thule Group AB earnings.
Thule Group AB revenue for the last quarter amounts to 198.55 M USD, despite the estimated figure of 192.30 M USD. In the next quarter, revenue is expected to reach 288.66 M USD.
THLPF net income for the last quarter is 2.27 M USD, while the quarter before that showed 33.25 M USD of net income which accounts for −93.17% change. Track more Thule Group AB financial stats to get the full picture.
Thule Group AB dividend yield was 3.46% in 2025, and payout ratio reached 80.32%. The year before the numbers were 2.43% and 78.35% correspondingly. See high-dividend stocks and find more opportunities for your portfolio.
EBITDA measures a company's operating performance, its growth signifies an improvement in the efficiency of a company. Thule Group AB EBITDA is 216.94 M USD, and current EBITDA margin is 19.24%. See more stats in Thule Group AB financial statements.
Like other stocks, THLPF shares are traded on stock exchanges, e.g. Nasdaq, Nyse, Euronext, and the easiest way to buy them is through an online stock broker. To do this, you need to open an account and follow a broker's procedures, then start trading. You can trade Thule Group AB stock right from TradingView charts — choose your broker and connect to your account.
Investing in stocks requires a comprehensive research: you should carefully study all the available data, e.g. company's financials, related news, and its technical analysis. So Thule Group AB technincal analysis shows the sell today, and its 1 week rating is sell. Since market conditions are prone to changes, it's worth looking a bit further into the future — according to the 1 month rating Thule Group AB stock shows the strong sell signal. See more of Thule Group AB technicals for a more comprehensive analysis.
If you're still not sure, try looking for inspiration in our curated watchlists.
If you're still not sure, try looking for inspiration in our curated watchlists.