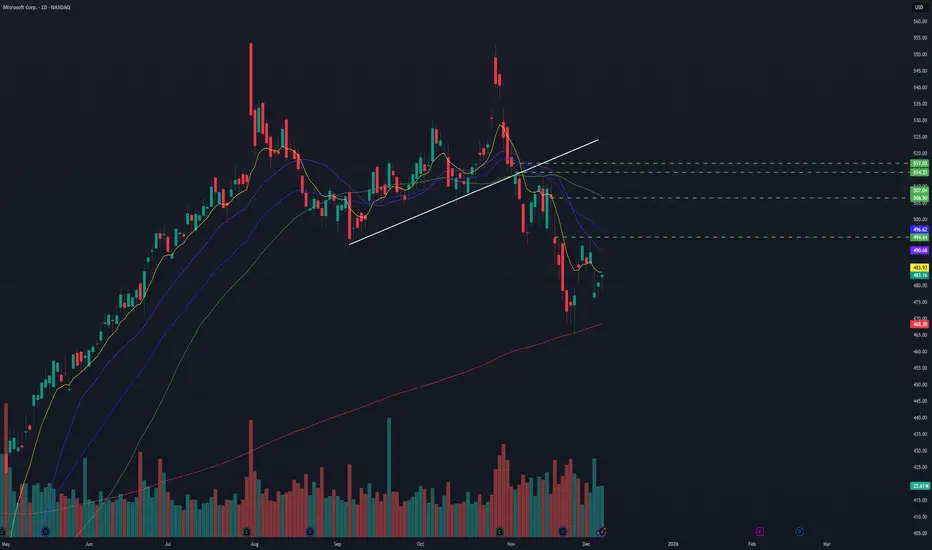
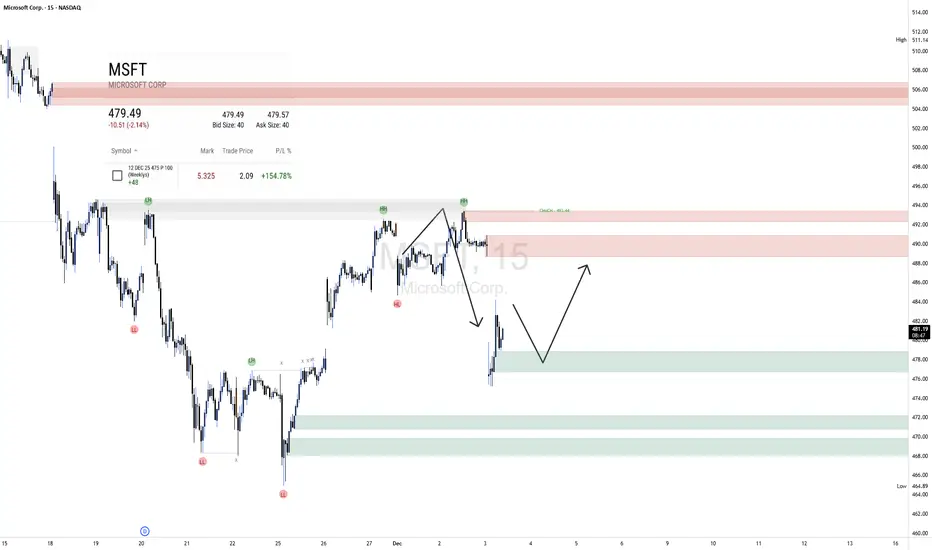
$MSFT establishing HTF support at 200 day MATagged 200 day MA and bounced. Slight retest already happened. If the daily doesn't form a bear flag then it could easily target the gap at 495.
Options flow supports exactly that with call flow for the next two weeks expirations targeting 495 and 500
Key facts today
Next report date
—
Report period
—
EPS estimate
—
Revenue estimate
—
12.027 EUR
86.45 B EUR
239.16 B EUR
7.32 B
About Microsoft Corp.
Sector
Industry
CEO
Satya Nadella
Website
Headquarters
Redmond
Founded
1975
ISIN
US5949181045
FIGI
BBG000RYMVG5
Microsoft Corp. engages in the development and support of software, services, devices, and solutions. It operates through the following segments: Productivity and Business Processes, Intelligent Cloud, and More Personal Computing. The Productivity and Business Processes segment is composed of products and services relating to productivity, communication, and information services such as Office Commercial, Office Consumer, LinkedIn, and Dynamics business solutions. The Intelligent Cloud segment consists of public, private, and hybrid server products and cloud services for businesses and developers, as well as enterprise and partner services. The More Personal Computing segment refers to products and services including Windows operating system, Windows cloud services, Surface, HoloLens, personal computer accessories, Xbox hardware, Xbox Cloud Gaming, Microsoft News, and Microsoft Edge. The company was founded by Paul Gardner Allen and William Henry Gates, III in 1975 and is headquartered in Redmond, WA.
Related stocks
$MSFT Horizontal consolidation If the current context remain, I would see NASDAQ:MSFT doing horizontal consolidation between range $467-$556
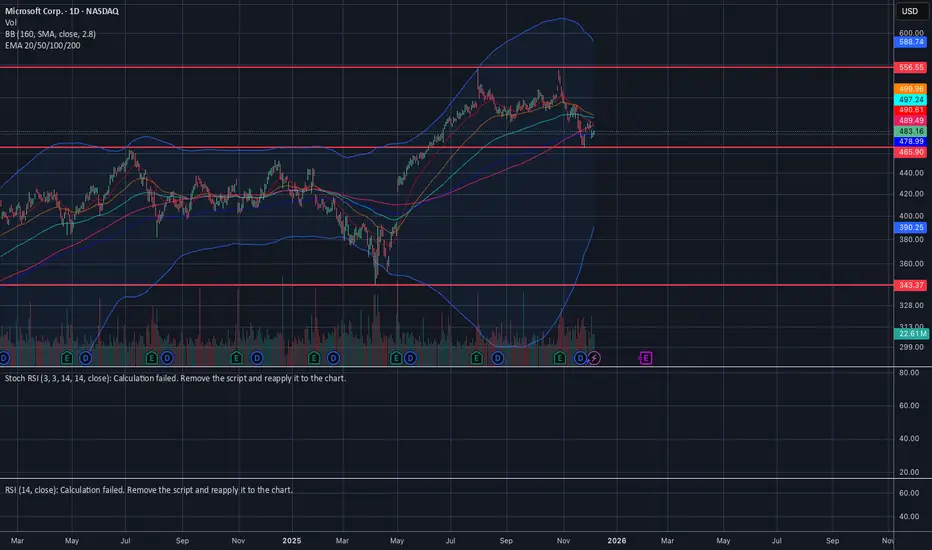
$MSFT Bottom $455 oversold $425NASDAQ:MSFT Is a predictable machine $455 is the bottom margin for error could drop $425 in oversold situation.
All their fundamentals align and show the same pattern every time.
typically around this time we should see a dip which finds support at the last wave's highs.
there really isnt more

Quant signals MSFT Weekly PUT: Institutional Bearish MomentumDirection: BUY PUTS (SHORT)
Confidence: 65% (Medium)
Strike: $475.00
Entry Price: $4.10
Target 1: $6.15 (50% gain)
Target 2: $8.20 (100% gain)
Stop Loss: $2.87 (30% loss)
Expiry: 2025-12-05 (2 days)
Position Size: 2% of portfolio
Weekly Momentum: BEARISH (-2.82%)
Options Flow: Bearish (PCR
Microsoft (NASDAQ: $MSFT) Drops as AI Sales Miss Targets Microsoft (NASDAQ: NASDAQ:MSFT ) slid more than 2% after a report from The Information claimed that the company had reduced growth targets for its AI products because sales teams failed to meet expectations. The report highlighted that several Azure sales units missed ambitious quotas tied to Found

MSFT Swing Buy Setup — Multi-Factor Bullish Confirmation📈 MSFT QuantSignals V3 Swing Analysis | 2025-12-08
MSFT Swing Signal — 2025-12-08
• Direction: BUY CALLS
• Confidence: 65%
• Horizon: 18 days → 2025-12-26 expiry
• Strike Focus: $460.00
• Entry Range: $33.70
• Target 1: $49.80
• Stop Loss: $23.50
• 1W Move: +1.49%
• 2W Move: +2.15%
• Volume: 1.0× v

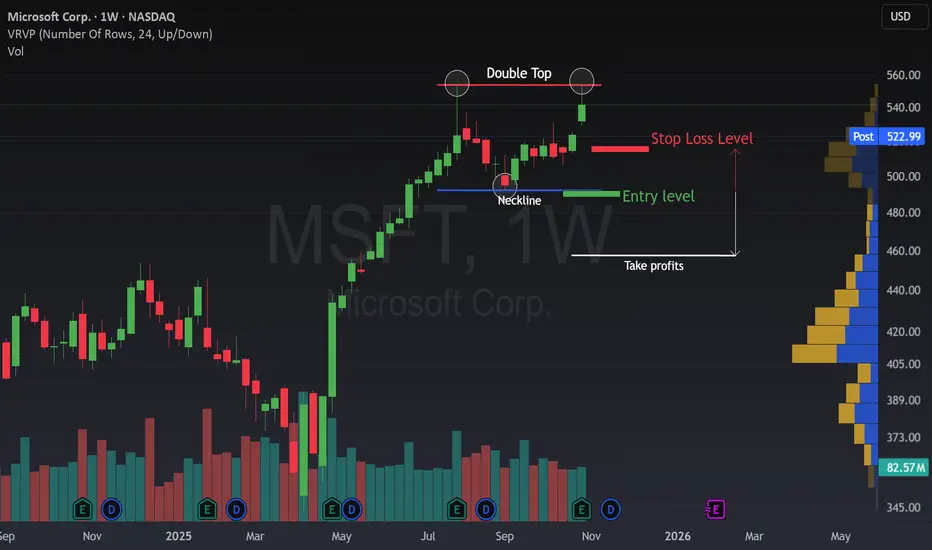
MSFT PullbackPattern Identified: Bearish Double Top pattern confirmed on Microsoft ( NASDAQ:MSFT ) with neckline break and clear measured move objectives. Neckline Break Triggers Measured Move to Gap Fill.
Key Confluence:
First Top: Initial rejection
Second Top: Failed breakout, lower high
Neckline: Support con

A Double Top in MSFT has just appeared.The weekly chart of Microsoft (MSFT) is showing a potential Double Top formation, a classic sign that bullish momentum might be losing strength .
🔹 Bullish Scenario: As long as the price stays above the blue neckline , the uptrend remains intact. Buyers are still in control, and a clear breako
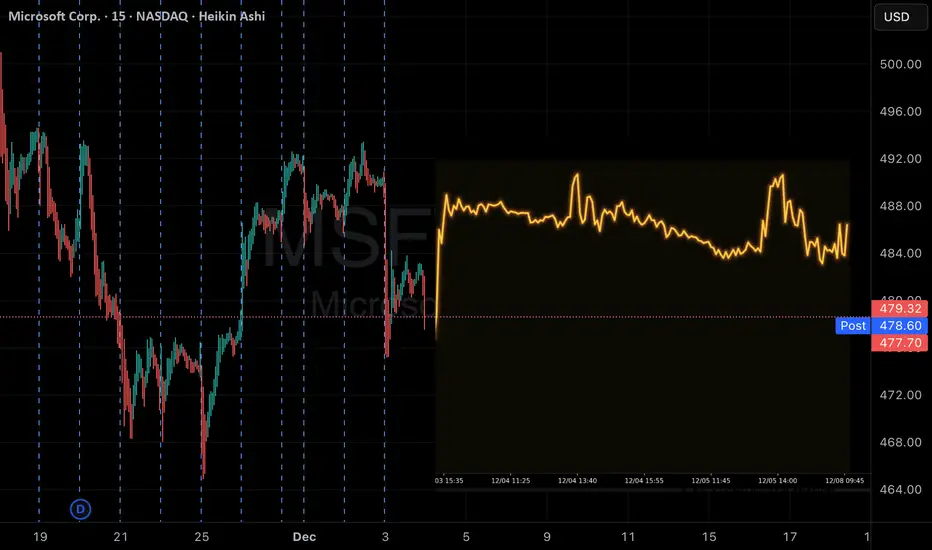
MSFT LongBroader Market Structure
MSFT on the 15-minute chart is in a short-term uptrend following a sequence of higher lows and higher highs from the $464 area. The key structural shift occurred when price printed a CHoCH at $492.44, breaking above the previous swing high and confirming bullish intent. Bef
MSFT: Next Long Term Buy ZoneMicrosoft has staged a strong rally since the April tariff-related selloff, rebounding significantly but ultimately failing to set a new meaningful high in October. While the company’s earnings have remained relatively strong, it is still a publicly traded stock and therefore susceptible to broader

See all ideas
Summarizing what the indicators are suggesting.
Neutral
SellBuy
Strong sellStrong buy
Strong sellSellNeutralBuyStrong buy
Neutral
SellBuy
Strong sellStrong buy
Strong sellSellNeutralBuyStrong buy
Neutral
SellBuy
Strong sellStrong buy
Strong sellSellNeutralBuyStrong buy
An aggregate view of professional's ratings.
Neutral
SellBuy
Strong sellStrong buy
Strong sellSellNeutralBuyStrong buy
Neutral
SellBuy
Strong sellStrong buy
Strong sellSellNeutralBuyStrong buy
Neutral
SellBuy
Strong sellStrong buy
Strong sellSellNeutralBuyStrong buy
Displays a symbol's price movements over previous years to identify recurring trends.
ATVI4499883
Activision Blizzard, Inc. 4.5% 15-JUN-2047Yield to maturity
6.87%
Maturity date
Jun 15, 2047
ATVI5026499
Activision Blizzard, Inc. 2.5% 15-SEP-2050Yield to maturity
6.34%
Maturity date
Sep 15, 2050
ATVI4495111
Activision Blizzard, Inc. 3.4% 15-SEP-2026Yield to maturity
5.27%
Maturity date
Sep 15, 2026
See all MSF bonds
Curated watchlists where MSF is featured.


Frequently Asked Questions
The current price of MSF is 421.000 EUR — it has decreased by −0.30% in the past 24 hours. Watch Microsoft Corporation stock price performance more closely on the chart.
Depending on the exchange, the stock ticker may vary. For instance, on TRADEGATE exchange Microsoft Corporation stocks are traded under the ticker MSF.
MSF stock has risen by 0.55% compared to the previous week, the month change is a −2.47% fall, over the last year Microsoft Corporation has showed a 0.21% increase.
We've gathered analysts' opinions on Microsoft Corporation future price: according to them, MSF price has a max estimate of 631.08 EUR and a min estimate of 432.25 EUR. Watch MSF chart and read a more detailed Microsoft Corporation stock forecast: see what analysts think of Microsoft Corporation and suggest that you do with its stocks.
MSF stock is 0.57% volatile and has beta coefficient of 0.96. Track Microsoft Corporation stock price on the chart and check out the list of the most volatile stocks — is Microsoft Corporation there?
Today Microsoft Corporation has the market capitalization of 3.14 T, it has increased by 3.09% over the last week.
Yes, you can track Microsoft Corporation financials in yearly and quarterly reports right on TradingView.
Microsoft Corporation is going to release the next earnings report on Feb 4, 2026. Keep track of upcoming events with our Earnings Calendar.
MSF earnings for the last quarter are 3.52 EUR per share, whereas the estimation was 3.13 EUR resulting in a 12.49% surprise. The estimated earnings for the next quarter are 3.36 EUR per share. See more details about Microsoft Corporation earnings.
Microsoft Corporation revenue for the last quarter amounts to 66.19 B EUR, despite the estimated figure of 64.34 B EUR. In the next quarter, revenue is expected to reach 68.96 B EUR.
MSF net income for the last quarter is 23.65 B EUR, while the quarter before that showed 23.12 B EUR of net income which accounts for 2.28% change. Track more Microsoft Corporation financial stats to get the full picture.
Yes, MSF dividends are paid quarterly. The last dividend per share was 0.79 EUR. As of today, Dividend Yield (TTM)% is 0.69%. Tracking Microsoft Corporation dividends might help you take more informed decisions.
Microsoft Corporation dividend yield was 0.67% in 2025, and payout ratio reached 24.34%. The year before the numbers were 0.67% and 25.42% correspondingly. See high-dividend stocks and find more opportunities for your portfolio.
As of Dec 9, 2025, the company has 228 K employees. See our rating of the largest employees — is Microsoft Corporation on this list?
EBITDA measures a company's operating performance, its growth signifies an improvement in the efficiency of a company. Microsoft Corporation EBITDA is 149.79 B EUR, and current EBITDA margin is 57.74%. See more stats in Microsoft Corporation financial statements.
Like other stocks, MSF shares are traded on stock exchanges, e.g. Nasdaq, Nyse, Euronext, and the easiest way to buy them is through an online stock broker. To do this, you need to open an account and follow a broker's procedures, then start trading. You can trade Microsoft Corporation stock right from TradingView charts — choose your broker and connect to your account.
Investing in stocks requires a comprehensive research: you should carefully study all the available data, e.g. company's financials, related news, and its technical analysis. So Microsoft Corporation technincal analysis shows the sell today, and its 1 week rating is neutral. Since market conditions are prone to changes, it's worth looking a bit further into the future — according to the 1 month rating Microsoft Corporation stock shows the buy signal. See more of Microsoft Corporation technicals for a more comprehensive analysis.
If you're still not sure, try looking for inspiration in our curated watchlists.
If you're still not sure, try looking for inspiration in our curated watchlists.