BB trade ideas

BlackBerry - BUY THE DIP! IT'S TIME TO MOON This latest drop Is such an opportunity. This has massive moon potential from here. Let's Go!

The next Blackberry bounce, new long entry opportunity?Blackberry NYSE:BB has kept support in the 11-12 dollar range and is currently pre-market testing the prior support levels at 11.06 as of 8 AM on March 17. Short-term bullish longs may want to enter long for a bounce back to the 12.26 mark and keeping in mind that 11.06 is downward support. Note that the past two daily candles (March 15 & 16) were with a great deal of sell pressure which would both be short term investors/speculators exiting and bearish speculators shorting for a breakdown bellow 11 dollars. If buy pressure increases today then this would continue the week of predominantly bullish momentum. It would be a clear upward continuation signal. It is worth noting that bearish reversals have happened twice since the all time highs in late January. Over all direction is still bullish on the daily chart. Today (March 17) should be a retest of the 12.26 resistance level and should be a buy volume day to reverse the last two days of over all sell pressure.
For entertainment and educational advice. Not financial advice.

BBBlackBerry (NYSE:BB) is a stock I wrote about recently as one to watch for a potential reversal as one that has been on my bottom scan. Friday that reversal came to fruition to the tune of an 10.75% gain for the stock. Momentum indicators are looking bullish, with MACD crossing abv the signal line and the RSI breaching 50 and presently lies at 54.76. Watch for continuation next week.


retrace on this like GME didThe rest will follow the herd. It's just a matter of time before this returns to the 16$ region

The new Blackberry Hello fellow Blackberry enthusiast. We've had two false breakouts with Blackberry and the question is this the third with the new Blackberry really a long term breakout back to all time highs under Chen or just a nice bounce. Time and market conditions will tell. The daily charts have had a wicked battle between longs and shorts that have supported the thesis that blackberry is comfortably trading in the 10-11 dollar range. Price action generally overnight and premarket tanks past any day gains and indicates that bullish sentiment is finding stiff resistance against bearish speculation.
For bullish investors the Blackberry charts are slowly and positively moving back to test prior days highs. Currently the price is around 11.30 which as trend lines indicate is bullish sentiment in the short term and possibly long. Increasing speculation over the positive long term value of the stock including WSB has given both momentum to long and short speculation. Current trends continuing with several days above 11.06, then 12.26, and 13.07 would be a possible strong bull catalyst for a retest of all time highs. BB may simply be making higher highs and higher lows as it coils upward. Bearish speculators would likely want to short around these key levels to retest lows much as they did after uptrend 1 and 2. Fridays close should give a good guidance on possible direction in short and near term.
Bullish long term price targets would be the yellow marked levels. MacD and RSI trends seem to be indicating a strong bullish scenario but it is corollary to the wider Nasdaq which has proven to be bearish for much of February and March.
Long term targets could be as high a retest of the historic blackberry highs of 32.70, 68.64, and 125.07. It should be noted those prices are reflections of a dramatically different business model and may prove to be more conservative given the difference between the business models of the historic Blackberry before Chen and the new Blackberry after Chen. More bullish investors that believe the new Blackberry under Chen should be roughly equivalent peer to Crowdstrike CRWD at 196.88 or VMWARE at 147.32 at the time of this writing will have to prove it by increasing investment in the stock including short and long term bullish speculators and of course not only hitting but maintaining those price targets over extended periods. Volatility will increase as the price increases. Time will tell if the new Blackberry can re-capture Wallstreet investors and advisors higher price targets as it has Main street investors.
Not investment advice. For entertainment and education purposes only.

BB - Reversal success - Golden CrossAs you can see in the chart $BB 50 MA and 200 MA are about to meet at the famous 'Golden Cross'. Also it seems we might breakout out of the 11.15 resistance, denoted by the blue trend line. Looking very bullish, if market conditions hold.


BlackBerry Above $11 = Bullish BreakoutBB could be a ripping soon! If we can just get up to $11. This is speculation not financial advice.


BlackBerry - Clear to buy! Apes are rotating We'll start seeing massive rotation into BB from this point. GME and AMC topped out yesterday.


$BB Technical AnalysisAn example of a head-and-shoulders bottom chart pattern can be expected on the graph. Follow price for a breakout on the neck.

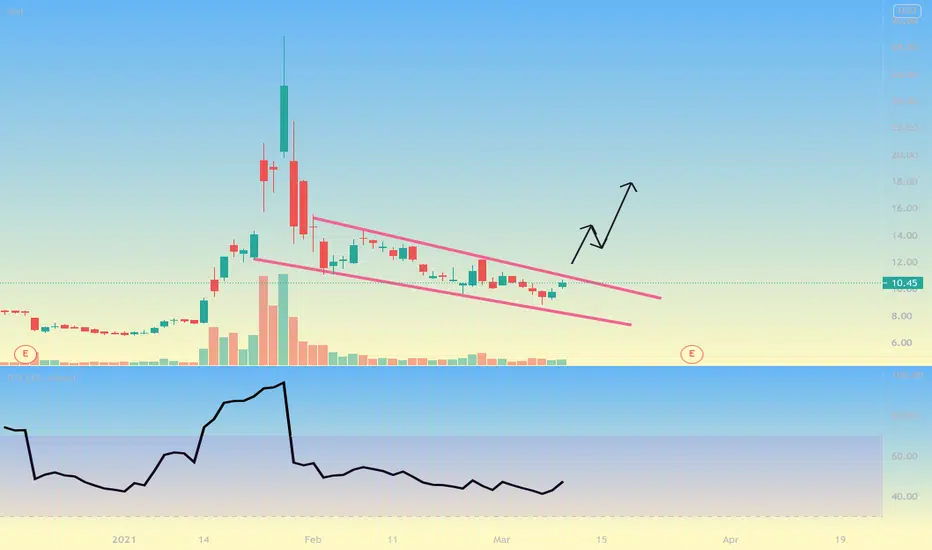
Bb uptrend updateSince bb went hyper parabolic it’s come back down to reality and found support back in the channel. Bb still has huge potential moving forward.

The MACD bar part is turning green with a positive divergencethe short-term target could be 17.5 or 20

AMC, GME flying this week! is BB up next?very tight downtrend channel here, not in yet but if i see 12 break i will add some shares with a price target of 15-20 in short term ! last time i played this it paid like 600% on calls! dont sleep on it :)
BB - Pitchfork Idea - Target $10.50Expanding on my previous idea. It seems $BB is doing a steady reversal (light yellow area), if market conditions hold. $BB found bottom at $8.96 during the last two week's red bath. Heavy resistance at $10.50, denoted by the magenta trend line. For a successful reversal we should be breaking through that resistance and holding.
I also want to note that the $8.96 was the price before $BB broke out during the WSB hype, which is the purple trend line.

BB continued downtrendHighly periodic variability between successive minima in recent weeks; most obvious on hourly chart. No divergence b/w price and RSI or volume-weighted RSI (MFI). I don't anticipate a reversal, but I do anticipate more volatility (for now). Very well-defined linear trading channel (R~0.91) recently, maybe the slope will break soon and a knee will emerge.

BB - Pitchfork IdeaSeems like for the past few weeks we have been in a downtrend after the WSB pump. We might be looking at a reversal in the yellow square area. We should be testing the 10.50 resistance, breaking and holding for the reversal to be successful.
Please be aware this is my first TA chart of this nature. I am learning as I go and I could make mistakes.
*Please note, none of my ideas are financial advice*

BlackBerry - over 1000% Gain in potential Acuisition? Guys, what your thoughts of BDU, MSFT or some other tech giant acquiring BB? Why would'nt this be supported or financed by Chinese gov. There has to be massive amount of interest of the US Cabinet and federal departments data .

BB Golden Zone!Hello Community!
Before we begin please support my idea with a thumbs up and a comment. It'll be greatly appreciated and will motivate me to post a little more!
BB has been one of those stocks everyone has had their eyes one the past few weeks. We can take a look at BB on the daily chart which is currently sitting on a few supports which I've drawn out for you. We can see it inside the golden zone which is indicated by the blue zone on the fib retracement. There's also a massive S/R line shown in white. The stock is currently trading right above the white line, with the MACD and RSI looking bullish, indicating a possible move up. It does appear that the bears have run out of steam.
This is not Financial advice.
Safe Trading Calculate Your Risk/Reward & Collect!
Simplicity Wins
