Great buying opportunity yesterday's break through was the first sign of support. Crossing $14.5 will be the second, until then it is in the buy zone with a stop loss at $12.8
Anything below $13.15 is a great target buy.
Looking at a 50% return here with how volatile this stock is....
WEED trade ideas

CGC reversal??CGC looks ready to pop. RSI curling up and price action indicates that this is the bottom. Call options are super cheap so I added a small position in anticipation of break above trendline.

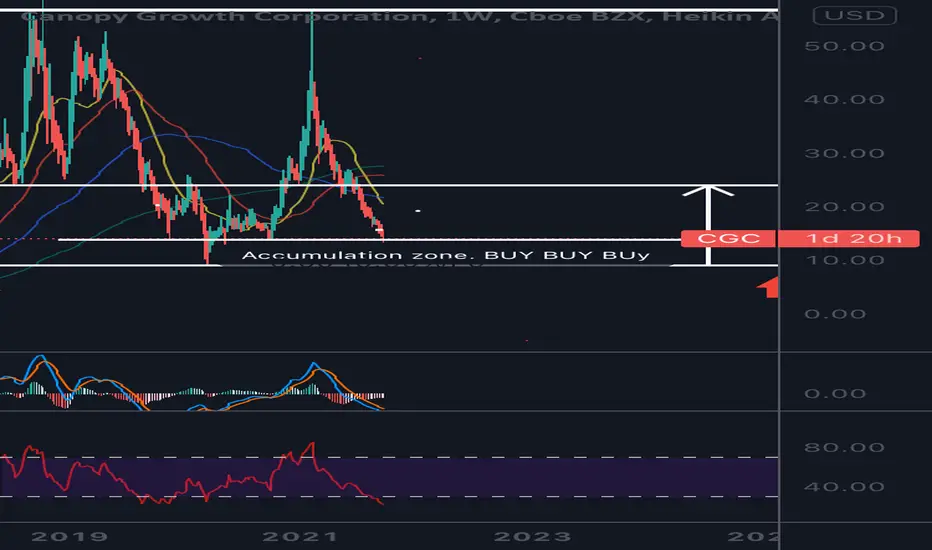
CGC Dead Cat BounceCGC looking very interesting holding $13 with next levels down at $11 and the March 2020 low of $9.
Expecting it to flush down out of the wedge to $11, not sure if it reaches $9.
Have starter positions and would really like to sell naked puts and buy leaps into capitulation type moves.
Anyone know any stocks below their March 2020 lows?
Are Canadian LPs really worse off now then when everyone thought the world was ending?

$CGC - can she finally break outLast October beat down a lot of small cap stocks before they started running. I would be careful here but breakouts have been happening in a lot of places. Beware of false breakouts but lets hope for a strong small cap run into February/March again!

GANN THEORY Strategize UPDATEWanted to post a couple of pictures about editing and cleaning up the strategy and make it more SIMPLE to understand the thought process of behind it. I had to Remove a couple of indicators names CM_SLINGSHOT and DREADBLITZ DRSI from the indicator am replacing these indicators w/ a 100 (p) exponential moving average to filter weather we should go long or short. Adding the Bull vs Bear Power by DGT. setting i have on this indicator is 13 check SUM, histogram, 1 smoothing, 0 recall, drop-down box to LEAST. 'This indicator and the CM_ULTIMATE_RSI MULTI TIME FRAME by Chris Moody works very harmoniously together. The following pictures will explain why. Also the alert can be set on the 70 30 lines of the RSI.
this picture shows the BULL vs BEAR POWER telling us the trend so we know what direction we should DIRECT it outwards to 'Project.'
based on the Direction of the trend on the Daily we alerts on the 70 30 lines of the RSI. and the 2 GANN-Fib lines ' usually its the .618 and .75 lines. (yes i rename my ALERTS as 70 30 and GANN FIB ALERT) easy tooltip to reference you already know what your looking at when you set something to crossing. i want to be sure to look at the Right thing when i get to the chart. '' focus '' type strategy.
example of one of my favorite trades to take with GANN---- its a RISK off (means if it goes the other way you only loosing a small fraction of profit.) But if it goes well like the example it can give 28 risk reward ratio. The second trade that is using the MTF_RSI, support resistance MTF, and BULL vs Bear power in all in sync.
this is on a 5min chart sorry for the resolution... but explaining the harmonious sympathy that these indicators make.
this is y i rather use the 5min chart with the 15min chart___ look at the that Blue line on the BULL VS BEAR POWER on the 5 min. perfect exit for full profit. If you use the EXIT 'last chance' you would of only had a small gain.
To sum this up, I take 2 different types of trades RISK OFF trades with GANN FIBS ___ you will see the S/R lvl to support the move. Then trades off the MTF_RSI after a pullback with conjunction of the BULL VS BEAR. My requirements are longs over 100 ema and shorts under 100 ema and the bull vs bear power has to say STRONG TREND __ADX RISING___ if it says ADX_FALLING then be warned.
Thanks for taking the time to read this i really appreciate any feedback.

CgcHit out first level we were eat hi f 13.82 was my area I got a bunch at 13.61$. Very nice bounce. Was expected a short term bounce here as it’s super clear level of interest. Let’s see if it’s holds up. I’ll be happy if it comes back down I want to buy more!!
Cgc- Are we ever getting out of the abyss zone. I fear that we might drop lower than historical data has shown. Lets hope it finds support and finds its way up again.


Looking for a bounceDaily RSI at historic Oversold bounce levels. Almost as beat up as the covid crash right now. In the past we have bounced 25%-80%+ when bouncing off this level of Oversold conditions. There is also a gap on the daily now above at these extreme conditions that needs to be filled
Also in a buy/support zone on the daily
Weekly Oversold
4HR at historic Oversold bounce levels
1HR at historic Oversold bounce levels
Daily looking to like a potential falling wedge, at price support/buy zone, at historic oversold levels with now a daily gap above to fill. A lot of confluence and the stars aligning for a good multi-day/weekly bounce out of OS conditions

WEED looking for a big bounceWEED is looking for a "big" bounce here. 5 waves down to prior support. Looking for 3 waves up to target 36.35 which is the .5 fib retrace. Great RR here. WEED could go even higher and target the golden zone retrace around 42-44 dollars. But i am looking for an ultimate low around 7.88 to finish the correction and move to new ATHs.
Trade safe,
Devin

$CGCCanopy Growth Corp stock is lower by -10.07% over the last 12 months, and the average rating from Wall Street analysts is a Hold.
InvestorsObserver’s proprietary ranking system, gives CGC stock a score of 33 out of a possible 100.
That rank is chiefly influenced by a long-term technical score of 12.
CGC's rank also includes a short-term technical score of 16.
The fundamental score for CGC is 71.
In addition to the average rating from Wall Street analysts, CGC stock has a mean target price of $23.14.
This means analysts expect the stock to rise 56.12% over the next 12 months.
But when we move to the technical side of things, Canopy Growth Corporation has been struggling to break above resistance for quite some time.
It’s also sitting in oversold territory so you’d expect price to retest resistance sometime next week.
If price is able to break above I have no question in my mind this will be a huge win.
Keep this on your watchlist.
- Factor Four


Daily Falling Wedge Heading into SeasonalityKeeping a sharp eye on this daily falling wedge that has developed along with bullish divergence. We know MJ has seasonality around voting season with more states putting legalization on ballots etc.
Price is also in a historical buy zone currently going back years. So fundamentally this is cheaper than in the past since more has developed in the sector since those price support levels back then.
Drilling down to the hourly we have oversold conditions in the teens along with the wedge trendline from the daily. Putting all the pieces of the puzzle together and I believe we will see a sentiment shift in the sector and this name is primed for at the very least a bounce, which could potentially put in the bottom here

Canopy growth corporationIt looks like to me it is setting up a big macro ala BTC 2020 Netflix 2005 setup. Where weed is going to the moon. There is still time to learn about fundamental side of things. and there is still time to see this if this is going to be a classic macro continuation. This is an idea and lets hope we can transfer some crypto money into this when the bubble of blockchains pops.

CGC - Your chance to feel good about your weed addictionThis is truly, your one and only chance to prove to your wife that your weed addiction is paying off. After awhile, she will join you, don't worry. You are just an early crusader, the pilgrim, the visionary and she doesn't know who she really married - THE LEGEND. This is your chance fellas don't blow it.
I mean look at this beauty.
I am holding this bag until it reached at least $100 and then $120. Options - F that. Buy and hold.
If you want to get into a growing market - this is it. Do you know how many people out there have never tried it? Do you know what happens after they try it? A huge line around the corner waiting to get in the MedMen store - the Apple of cannabis. Watch Tilray, CGC, Medmen, etc, closely.

CGC - Go long, REAL LONGCannabis trades like crypto.. Retraced 80%, now ready for a other runup.. only a matter of time before federal legalization occurs then massive upside

Canopy Getting HammeredCanopy Growth (WEED) is getting absolutely hammered. We're down over 7% this month after crashing over 20% in July. Imo, the stock is going to blow up when the US finally decriminalizes Cannabis. The opportunities for hemp are endless and of course the recreational market for drinks, bud, and all the rest is booming in legal markets. If I see a sub 20's print, I'll start accumulating. We have a solid floor around 12.90...

Canopy Growth Corporation LONG POSITIONCanopy Growth Corp. engages in the production and sale of medical cannabis.
In the recent period, we can observe a descending triangle pattern as well as a downtrend.
Last days, stocks reached the bottom-line of the Keltner channel.
Fibonacci retracement pattern was used to indicate targets.
The RSI shows a bullish divergence.
According to the MACD, we see a bullish confirmation hence the trend should move upwards. Also, the MACD line is located below the zero line, indicating the market is oversold.
Conclusion:
Position: LONG
Entry range: $ 18.04 - $ 19.56
Target range: $ 25.34 - $ 26.68
Stop loss: $ 17.34
NO financial advice

a bull set-up from Stochastic Full indicator.According to the Chart School from Stockcharts.com, a bull set-up from stochastic full is basically the inverse of a bullish divergence . The underlying security forms a lower high, but the Stochastic Oscillator forms a higher high. Even though the stock could not exceed its prior high, the higher high in the Stochastic Oscillator shows strengthening upside momentum. The next decline is then expected to result in a tradable bottom.
Horizontal lines and zones are supports (entry for bulls and exit for bears) and resistances (exits for bulls and entries for bears).
Diagonal lines from Fib fan/channel are for trend-determination and additional levels for active trading.
The market is actively moving so the entries and exits constantly change. Trade small if you want to practice!


assess its risks to capture its volatility into its earningIts earning is in the first week of August.
Trend(OBV) uses True Strength Index to analyze "On-Balance-Volume", which measures buying and selling pressure as a cumulative indicator.
Horizontal lines and zones are supports (entry for bulls and exit for bears) and resistances (exits for bulls and entries for bears).
Diagonal lines from Fib channel/fan are for trend-determination and additional levels for active trading.
The market is actively moving so the entries and exits constantly change. Trade small if you want to practice!

CGC BIAS: UpOverall in bear mode but due to short term buyer volume increase, short term upward movement is expected. Make sure to apply SL and TP.
