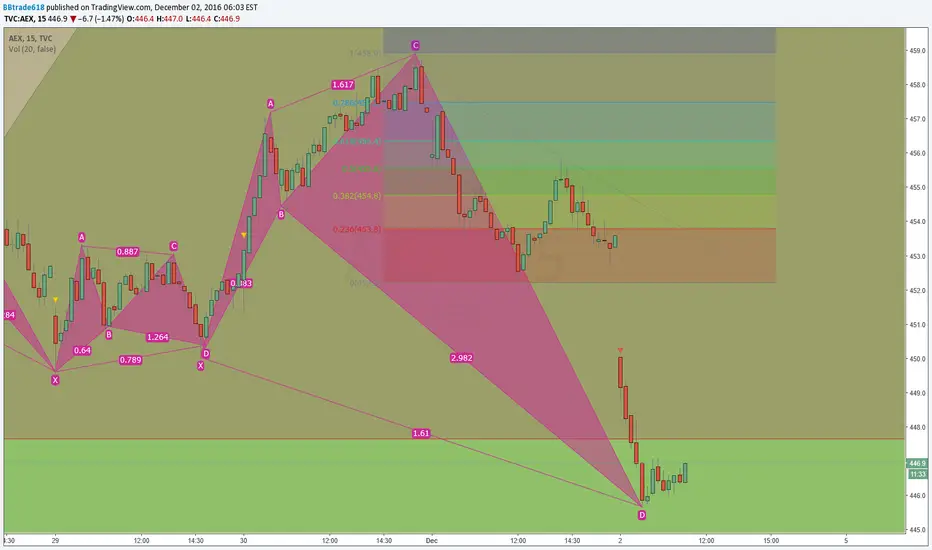
AEX as of 2nd dec 2016 (on a short and down day)What happend as foreseen by nummerology!
Harmonic allignement in point D lets trade long to 449 area.
AEX trade ideas
AEX as 1th of December 2016Trading on Thursday, bnp was bid only on several leverage products...so profits where not that big in end of the day trading.
Point C was a good point since Gann was in at 458,30 in fti

AEX trading on 29th of november 2016Valid long signal at point X occured in 5 and 3min tf however not massive power. Point D was a good trade to wait for!
Best to your trading.


How to hedge marketrisk with opposite movements in the market?In the follow graph you can see the following 'stocks':
GOLD ETF, AEX (indextracker) and Unilever
You can also see the expanded ghost patern that will predict the marketmovement/divergence between the 'stocks'.
In this case:
GOLD will fall = AEX will rise | Unilever will fall or rise 3.5% more than the AEX will rise or fall
(or)
AEX will fall = GOLD will rise | Unilever will fall or rise 3.5% more than the AEX will rise or fall
Why have i choose Unilver to compare with the index and gold?
*'Some stocks do heavly move in different directions, even if there are no updates from the company. Unilver is one of this kind of company's'. This means that we can hedge risk or take risk in combination with the prospected marketmovements in the index / commoditie
Information deserved from: Bloomberg and ING Markets


AEX is forming Head and Shoulder patternAEX is forming Head & Shoulder pattern with neck line around 437.5. When neck line doesn’t hold, the AEX could drop until around 410. This will form the head of another Head & Shoulder pattern.

AEX ShorttripAs a top got confirmed together with change in momentum, negative crossing of stochastics, i'm looking towards next levels.
446 as a support and bottom trendline.
Area around 438 again as support and bottom trendline.
A short position should be held as long no bottoming has formed around those levels.
Purpose is to let profits run.. everyone wants that.
So the Exp. MA 3 and 8 are helping to determine the trend. A close under Ema 3 is a strong downtrend.
During the trend the Ema 8 can be tested. As long no close occurs above the Ema 8 the short position remains.
Note that a strong reversal candlepattern might also trigger a take profit.

Why i am long Indices in Early October30/09/16:
Db just had a huge correction forcing Germany or ECB to step in pritty soon.
With this burden on an all time low its less to bother about for indices.
Sure if db crashes then you can say goodbye to this entire plan, but probably many plans will be garbage then.
And does the world really need a new financial crash?
I dont think so...
We recently had an opec deal to cut output, personally i am sceptical due to non opec producers beeing able to pick up the pace with higher prices so this may put some downward pressure into the upcoming month.
Last we have the us stock exchanges who are all near ath's and keep hovering around that zone with no immediate new problems to be sighted (excluding wells fargo perhaps) in usa i dont expect usa indices to put much pressure into european indices into early october.
Given the current aex price (also dax and other european indices) i am prity sure to open calls on eu indices with a targetdate of a few weeks.
Check in on the other charts as well i'll comment for a zoomed vieuw.

AEX seems to form a Head & Shoulders pattern in long runAEX seems to form a Head & Shoulders pattern, similar like in 2005-2008. Pattern starts with forming the left shoulder in summer 2013. And right shoulder starts February 2016. Right shoulder could make a top around end of first quarter 2017.

AEX - Call End of WeekUS and Asian markets closed lower last friday. AEX opened very low.
AEX recover till end of week. General sentiment is positive, although Draghi made it less positive last thursday.


AEX daytimeframe february - july compare to FTSE index
If we look at the AEX we are seeing an uptrend, but if we look at the FTSE, we are seeing an breaking-out above the upward trendline. If we look at the RSI index we are seeing an really long trend the last time above our upper band. If we look at the MACD we have some pression the last semair.
If are looking aging at our stockimage in the bollinger bands there could come some moment were the MA will cross under the basis line of the Bollinger bands. This means that there could be some pression what can results in a downtrend.
Also Bloomberg has been uploaded some content about the bad politic situation in the UK when the prime minister is getting out. This can also result in a shockwave in financial markets (most likely is the markets that are in correlation with the FTSE)
