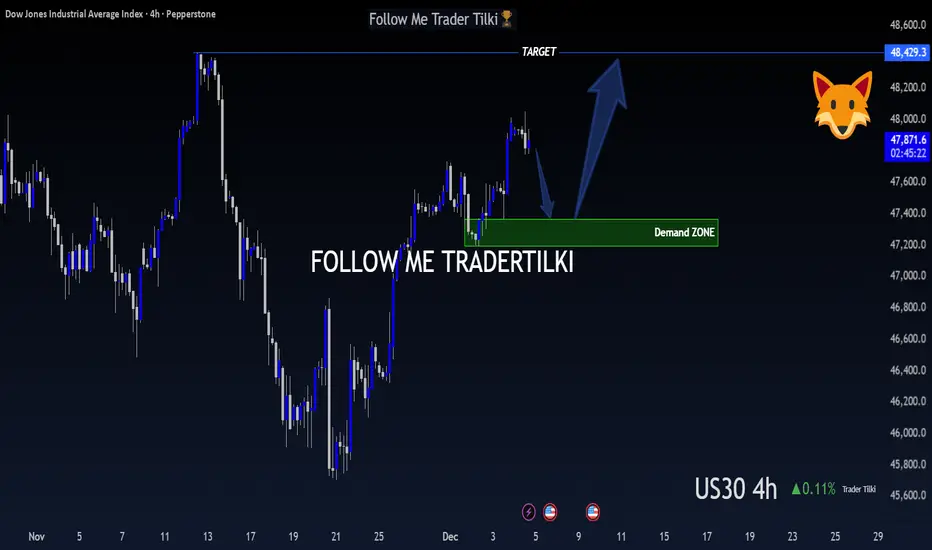
US30 (DOW JONES) – 4-Hour Timeframe Tradertilki AnalysisMy friends,
I have analyzed US30 on the 4-hour timeframe.
My friends, if US30 reaches the levels between 47,361 and 47,192, I will open a buy position.
My target will be the 48,429 level.
My friends, I share these analyses thanks to each like I receive from you.
Your likes increase my motivation
About Dow Jones Industrial Average Index
Dow Jones* often refers to the Dow Jones Industrial Average, which was one of the first stock indices and is one of the most commonly referred to barometers of equity performance in the United States. The Dow Jones Industrial Average, not to be confused with the Dow Jones Transportation index (which was the first index), is often called, "the Dow" or "DJIA," and consists of thirty stocks which traditionally were industrial-based. But in recent years as the US economy has become more consumer-oriented, the index has seen a change in composition that no longer has much to do with direct industrial investment.
Related indices
US30 analysisFirst post! I wanted to try something different and new by posting my understandings of US30. US30 tends to fake out before the real move. In my chart I like to label what I would consider whole number quarter levels. I like to wait to see some sort of opposite candle of the overall potential contin
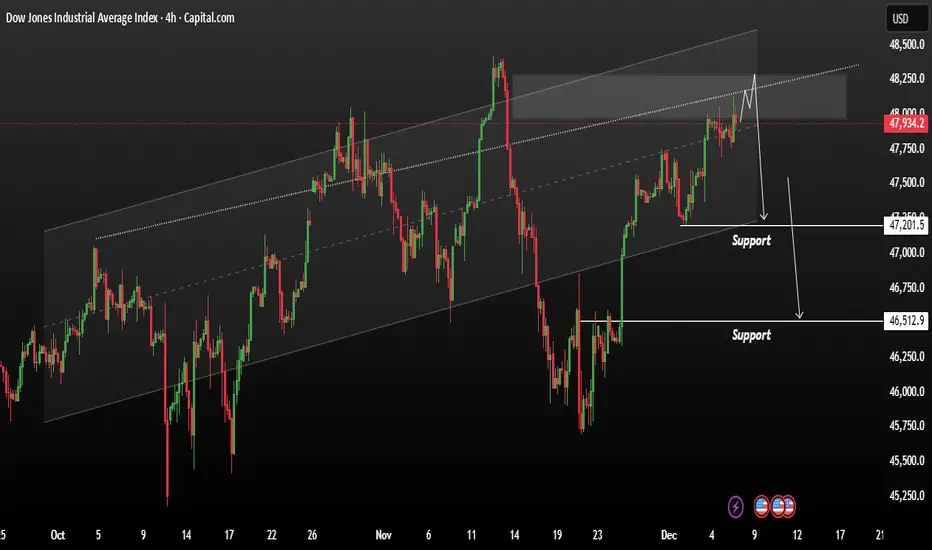
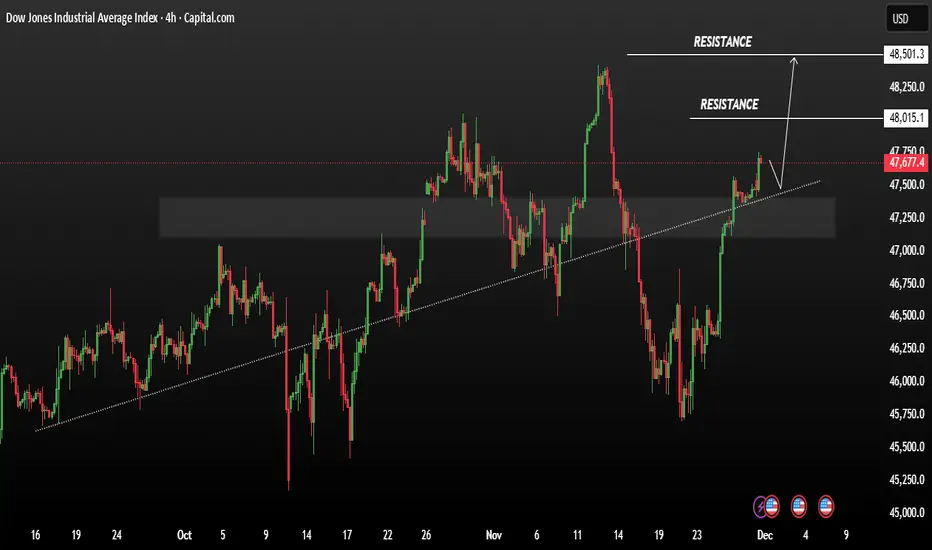
US30 Consolidation bearish range shift to support sideUS30 Consolidation bearish range action within a clearly defined ascending channel. The price has recently approached the upper boundary of this channel, where it appears to be facing resistance.
A projected path is drawn suggesting a potential short-term rejection from the upper channel line, with
US30 | Markets Brace for Fed Rate Cut DecisionUS30 – Technical Overview
Wall Street futures edged higher on Monday as traders prepared for one of the most closely watched—and divisive—Federal Reserve meetings in recent years.
Markets widely expect the Fed to deliver its long-awaited interest rate cut this week.
Last week’s delayed data showed
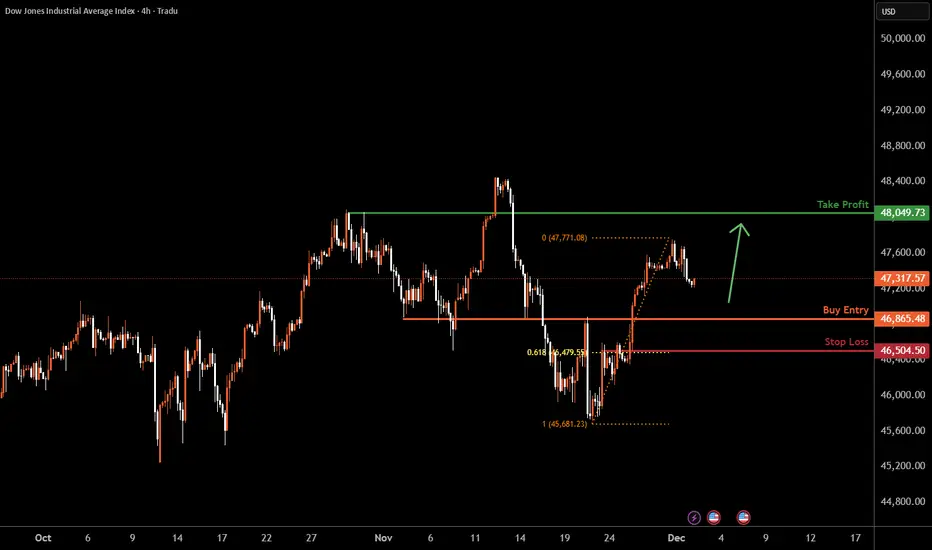
US30 H4 | Falling Towards Key SupportMomentum: Bullish
Price is pulling back toward our buy entry, which has been identified as an overlap support zone.
Buy Entry: 46,865.48
Strong overlap support
Stop Loss: 46,504.50
Pullback support
61.8% Fibonacci retracement
Take Profit: 48,049.73
Pullback resistance
High Risk Investment Warni
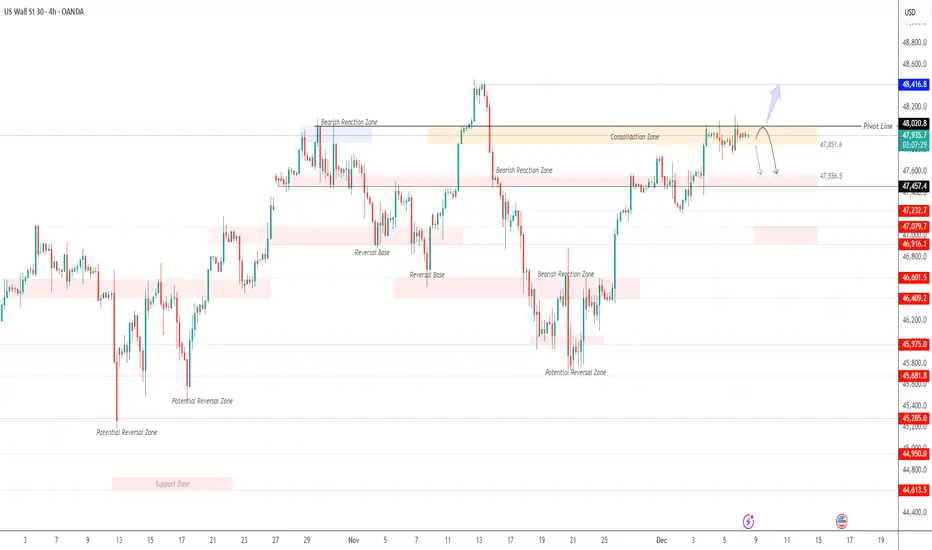
US30 Price consolidation bullish sequenceUS30 Price consolidation bullish sequence price action is shaping a potential continuation phase Price is currently testing a resistance zone,
Technically a rising trendline is supporting the price a well-defined ascending trendline has been respected multiple times price recently bounced from it a
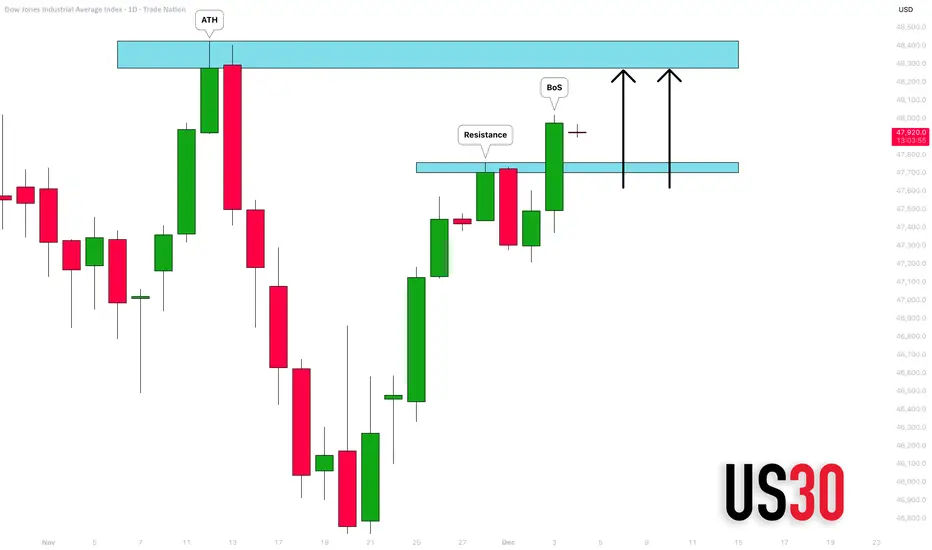
DOW JONES INDEX (US30): Confirmed BoS
With the yesterday's fundamental US news releases and
Trump's speech, US30 bounced strongly.
The market violated a significant daily resistance cluster
and closed above that.
It opens a potential for more growth to a resistance based
on a current All-Time High.
❤️Please, support my work wit

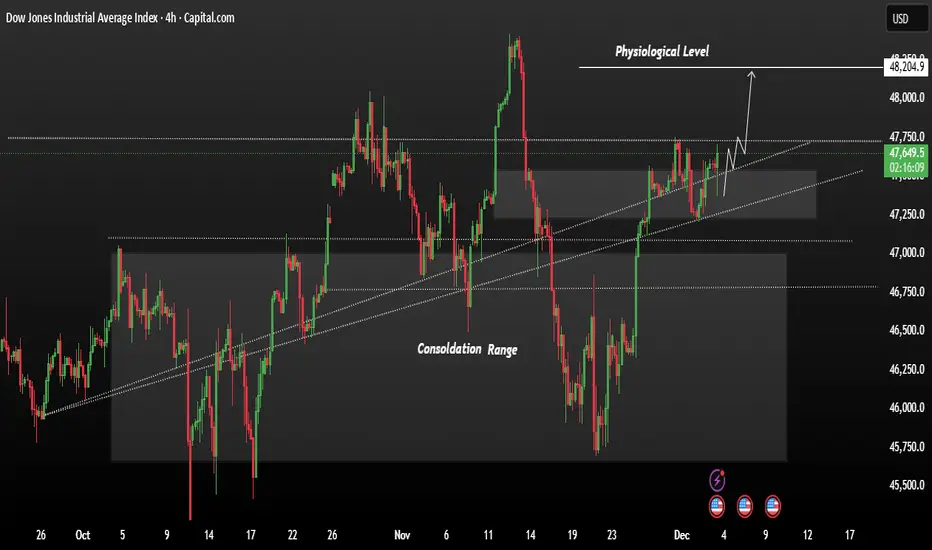
US3O showing strong bullish momentumUS30 is trading in a steady upward channel after breaking out of its previous consolidation range. Price is holding above support and showing strong bullish momentum.
As long as it stays above the current breakout zone, the market is positioned to push higher toward the next psychological level ar
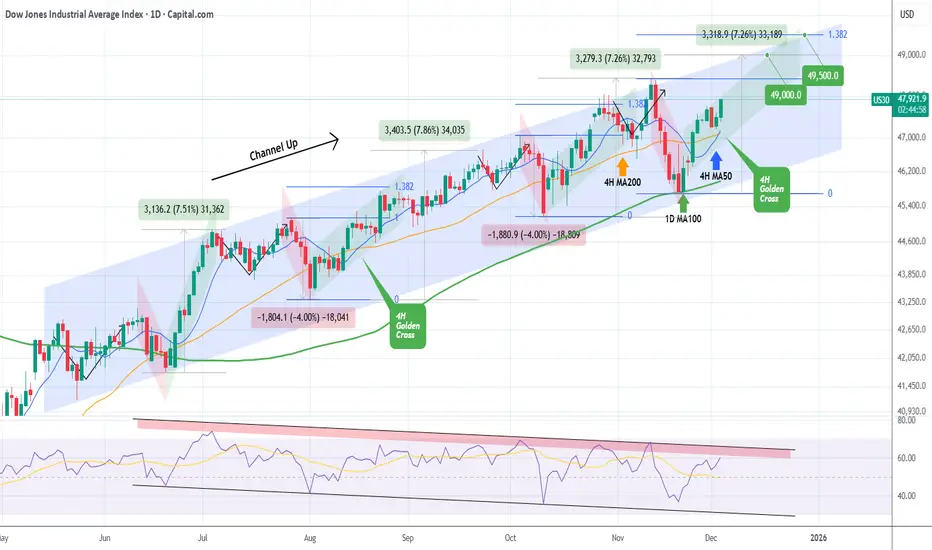
DOW JONES formed its first 4H Golden Cross since August. BullishDow Jones (DJI) has been trading within a 6-month Channel Up and today it formed its first 4H Golden Cross since August 15. Coming off a Higher Low bottom 2 weeks ago on the 1D MA100 (green trend-line), we are currently on the new Bullish Leg of the pattern.
The last one rose by +7.26%, roughly the
See all ideas
Summarizing what the indicators are suggesting.
Oscillators
Neutral
SellBuy
Strong sellStrong buy
Strong sellSellNeutralBuyStrong buy
Oscillators
Neutral
SellBuy
Strong sellStrong buy
Strong sellSellNeutralBuyStrong buy
Summary
Neutral
SellBuy
Strong sellStrong buy
Strong sellSellNeutralBuyStrong buy
Summary
Neutral
SellBuy
Strong sellStrong buy
Strong sellSellNeutralBuyStrong buy
Summary
Neutral
SellBuy
Strong sellStrong buy
Strong sellSellNeutralBuyStrong buy
Moving Averages
Neutral
SellBuy
Strong sellStrong buy
Strong sellSellNeutralBuyStrong buy
Moving Averages
Neutral
SellBuy
Strong sellStrong buy
Strong sellSellNeutralBuyStrong buy
Displays a symbol's price movements over previous years to identify recurring trends.
Frequently Asked Questions
The current value of Dow Jones Industrial Average Index is 47,888.05 USD — it has fallen by −0.45% in the past 24 hours. Track the index more closely on the Dow Jones Industrial Average Index chart.
Dow Jones Industrial Average Index reached its highest quote on Nov 12, 2025 — 48,431.57 USD. See more data on the Dow Jones Industrial Average Index chart.
The lowest ever quote of Dow Jones Industrial Average Index is 28.48 USD. It was reached on Aug 8, 1896. See more data on the Dow Jones Industrial Average Index chart.
Dow Jones Industrial Average Index value has increased by 0.33% in the past week, since last month it has shown a 2.01% increase, and over the year it's increased by 7.28%. Keep track of all changes on the Dow Jones Industrial Average Index chart.
The top companies of Dow Jones Industrial Average Index are NASDAQ:NVDA, NASDAQ:AAPL, and NASDAQ:MSFT — they can boast market cap of 4.51 T USD, 4.11 T USD, and 3.65 T USD accordingly.
The highest-priced instruments on Dow Jones Industrial Average Index are NYSE:GS, NYSE:CAT, and NASDAQ:MSFT — they'll cost you 866.69 USD, 596.50 USD, and 491.02 USD accordingly.
The champion of Dow Jones Industrial Average Index is NYSE:CAT — it's gained 49.82% over the year.
The weakest component of Dow Jones Industrial Average Index is NYSE:UNH — it's lost −44.41% over the year.
Dow Jones Industrial Average Index is just a number that lets you track performance of the instruments comprising the index, so you can't invest in it directly. But you can buy Dow Jones Industrial Average Index futures or funds or invest in its components.
The Dow Jones Industrial Average Index is comprised of 29 instruments including NASDAQ:NVDA, NASDAQ:AAPL, NASDAQ:MSFT and others. See the full list of Dow Jones Industrial Average Index components to find more opportunities.