Market Hunter: NASDAQ-NAS100 Sell OpportunityMy friends, Good morning!☀️
For US100-NAS100, I will open a SELL position between 24,988 and 25,243, targeting 23,843.📊
My friends, I share these analyses thanks to every single like I receive from you.
Your likes increase my motivation and make me want to support you in this way.🙏
I sincerely thank all my friends who support me with their likes.❤️
Trade ideas

Nasdaq - The final blow-off top!⚰️Nasdaq ( TVC:NDQ ) can rally a final +25%:
🔎Analysis summary:
Just this month, we witnessed quite some volatility on the Nasdaq with a correction of about -10%. However, bulls immediately stepped in and clearly pushed price higher. Since there is still bullish pressure, a final blow-off top rally in the near future is quite likely.
📝Levels to watch:
$25,000 and $30,000
SwingTraderPhil
SwingTrading.Simplified. | Investing.Simplified. | #LONGTERMVISION

US100: Bullish Breakout Confirmed, But...US100: Bullish Breakout Confirmed, But a Healthy Pullback Is Needed
I would like to see a correction before buying US100
US100 has recently confirmed a Descending Broadening Wedge breakout, a pattern that typically signals the resumption of a strong bullish trend.
However, we are still in a low-liquidity moment, which often causes unpredictable spikes and pullbacks. For that reason, I prefer to wait for a correction before entering long positions, rather than chasing the price at the current levels.
For traders who believe US100 could continue upward immediately, long-expiration CALL Options may be a safer alternative.
These options help reduce the impact of intraday volatility and erratic movements caused by the thin market conditions.
Key Resistance Levels to Watch
25,715
26,165
27,000
27,500
You may find more details in the chart!
Thank you and Good Luck!
❤️PS: Please support with a like or comment if you find this analysis useful for your trading day❤️

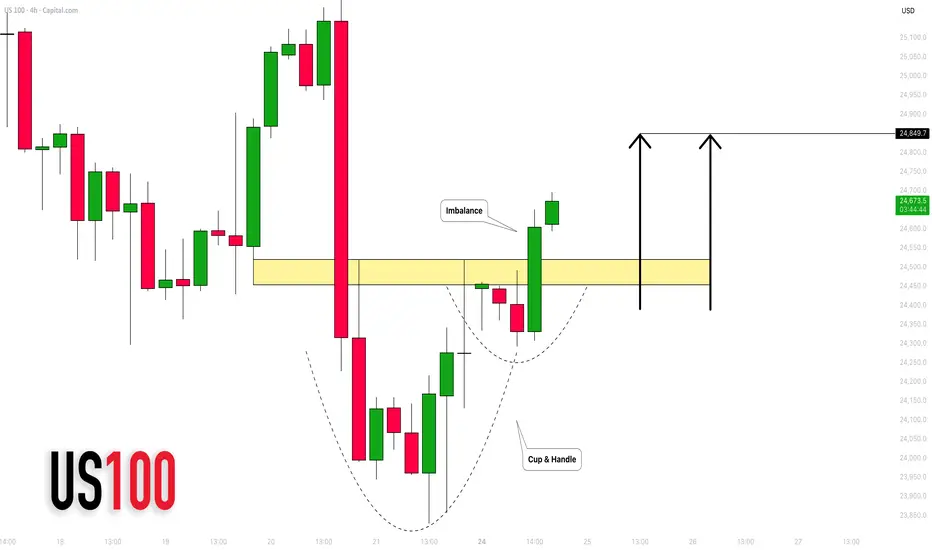
NASDAQ INDEX (US100): Strong Bullish Pattern
There is a high chance that US100 will rise
after a formation of a cup & handle pattern on a 4h time frame
with a breakout of its neckline with a bullish imbalance.
Expect a rise at least to 24850
❤️Please, support my work with like, thank you!❤️
I am part of Trade Nation's Influencer program and receive a monthly fee for using their TradingView charts in my analysis.
NAS SELLS based on market structure and resistance holding/ the structure shows sells continuation and strength, as it is alwasy said never trade against the trend

NASDAQ Santa Rally already underway.Nasdaq (NDX) has made a strong V-shaped recovery on its 1D MA100, as projected on our previous analysis and is extending the uptrend above the 4H MA200 (orange trend-line).
The rally may need a relief pull-back towards its 4H MA50 (blue trend-line) but technically, the seasonal end-of-the-year 'Santa Rally' is already underway.
V-shaped recovery and Inverse Head and Shoulders patterns typically target their 2.0 Fibonacci extensions. That is currently at 26600.
---
** Please LIKE 👍, FOLLOW ✅, SHARE 🙌 and COMMENT ✍ if you enjoy this idea! Also share your ideas and charts in the comments section below! This is best way to keep it relevant, support us, keep the content here free and allow the idea to reach as many people as possible. **
---
💸💸💸💸💸💸
👇 👇 👇 👇 👇 👇

Tech bubble burst?The Head and Shoulders (H&S) pattern is a classic reversal formation, typically found after a mature uptrend. It represents a gradual loss of buying pressure and a transition toward a potential downward move.
The H&S pattern often signals the exhaustion of bullish momentum, a shift in control toward sellers, and the possible beginning of a deeper reversal (sell-off).

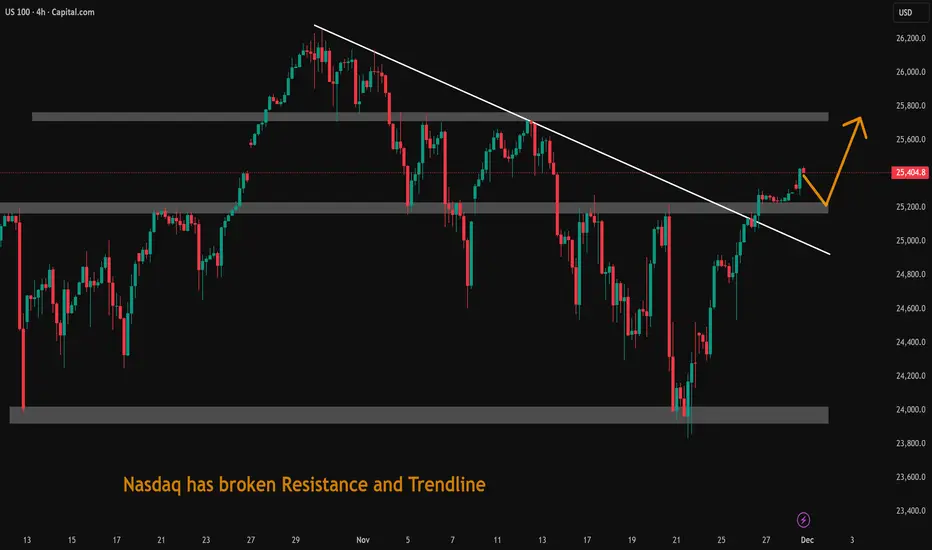
Nasdaq has broken Resistance and TrendlineNasdaq has broken Resistance and Trendline. US economy is doing well. Uptrend may continue.
Potential bullish bounce?NAS100 is reacting off the support level which is a pullback support and could could bounce from this level to our take profit.
Entry: 24,743.72
Why we like it:
There is a pullback support level.
Stop loss: 24,332.99
Why we like it:
There is a pullback support level.
Take profit: 25,790.42
Why we like it:
There is a pullback resistance that aligns with the 78.6% Fibonacci retracement.
Enjoying your TradingView experience? Review us!
Please be advised that the information presented on TradingView is provided to Vantage (‘Vantage Global Limited’, ‘we’) by a third-party provider (‘Everest Fortune Group’). Please be reminded that you are solely responsible for the trading decisions on your account. There is a very high degree of risk involved in trading. Any information and/or content is intended entirely for research, educational and informational purposes only and does not constitute investment or consultation advice or investment strategy. The information is not tailored to the investment needs of any specific person and therefore does not involve a consideration of any of the investment objectives, financial situation or needs of any viewer that may receive it. Kindly also note that past performance is not a reliable indicator of future results. Actual results may differ materially from those anticipated in forward-looking or past performance statements. We assume no liability as to the accuracy or completeness of any of the information and/or content provided herein and the Company cannot be held responsible for any omission, mistake nor for any loss or damage including without limitation to any loss of profit which may arise from reliance on any information supplied by Everest Fortune Group.

NAS100 | Bullish Bounce Off Pullback SupportMomentum: Bullish
Price is currently above the ichimoku cloud.
Buy entry: 25,308.70
- Pullback support
- 23.6% Fib retracement
Stop Loss: 25,092.80
- Multi-swing low support
Take Profit: 25,553.90
- Swing high resistance
- 127.2% Fib extension
High Risk Investment Warning
Stratos Markets Limited (tradu.com/uk ), Stratos Europe Ltd (tradu.com/eu ):
CFDs are complex instruments and come with a high risk of losing money rapidly due to leverage. 70% of retail investor accounts lose money when trading CFDs with this provider. You should consider whether you understand how CFDs work and whether you can afford to take the high risk of losing your money.
Stratos Global LLC (tradu.com/en ): Losses can exceed deposits.
Please be advised that the information presented on TradingView is provided to Tradu (‘Company’, ‘we’) by a third-party provider (‘TFA Global Pte Ltd’). Please be reminded that you are solely responsible for the trading decisions on your account. Any information and/or content is intended entirely for research, educational and informational purposes only and does not constitute investment or consultation advice or investment strategy. The information is not tailored to the investment needs of any specific person and therefore does not involve a consideration of any of the investment objectives, financial situation or needs of any viewer that may receive it. Past performance is not a reliable indicator of future results. Actual results may differ materially from those anticipated in forward-looking or past performance statements. We assume no liability as to the accuracy or completeness of any of the information and/or content provided herein and the Company cannot be held responsible for any omission, mistake nor for any loss or damage including without limitation to any loss of profit which may arise from reliance on any information supplied by TFA Global Pte Ltd.

NAS long idea for market open 25/11/2025Currently in a range between H1 polarity/M1 polarity at the top, mirrored to H1/M1 polarity at the bottom.
H4 range trend just below polarity, price comes down to M1 polarity, taps the H4 range trend, absorbs previous H4 low, back up to fail the top of the range and onto the H4 range trend above

NAS100: Momentum Weakening — Watching for a Short Into Recent LoNASDAQ is showing signs of short-term exhaustion, with momentum favouring another attempt lower. A deeper pullback into the trendline is possible but uncertain.

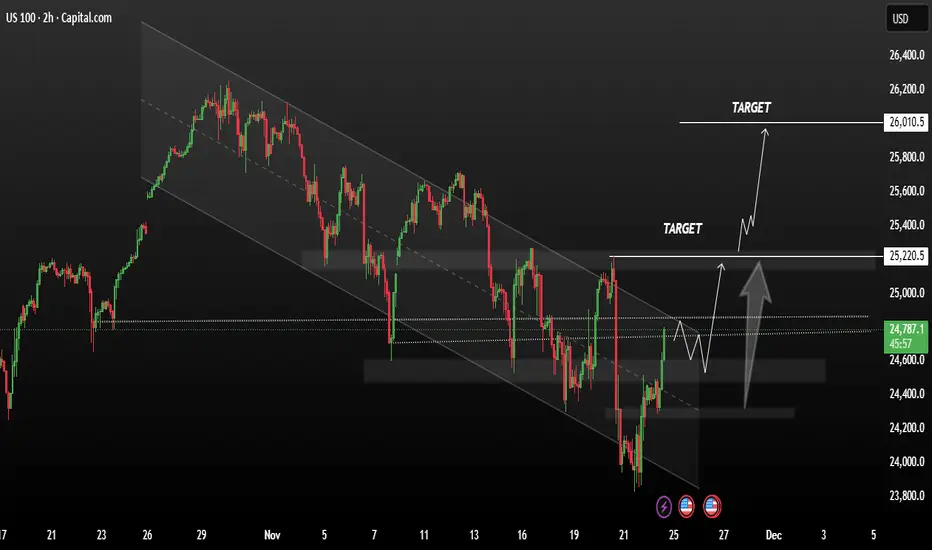
USNAS100 maintains current bullish momentumUSNAS100 moved higher on Monday, driven by gains in mega-cap stocks. Growing expectations of a potential Federal Reserve rate cut in December supported bullish sentiment, while investors monitored fresh economic data for signals on the central bank’s next policy direction.
If the index maintains its current bullish momentum, the market structure suggests a potential continuation to the upside. In the short term, we could see price movement toward the resistance zone between 25,220 and 26,010, where bullish reactions may occur if buyers remain in control.
You may find more details in the chart,
Trade wisely best of Luck Buddies,
Ps; Support with like and comments for better analysis Thanks for Supporting.
NAS100 Sits at Key LevelPrice is sitting right on top of major support. This level has been holding up nicely before, and it's also a strong psychological round number, which means buyers naturally defend it harder.
This is where buyers stepped in aggressively the last time. And where reactions tend to be violent.
This is the market literally waiting for a catalyst.
And here’s the important part:
If buyers manage to hold this zone?
We could easily see price pushing back toward 24,750.
BUT…If this support gives way…Then everything changes.
A breakdown here would invalidate the bullish structure entirely and starts a larger bearish move. When a level this strong breaks, it usually drops hard and strong.
So right now, the market is at a crossroads.
A clean break + retest below this level would confirm it.
In short:
👉 Hold the zone → bullish push toward 24,750
👉 Lose the zone → strong bearish continuation

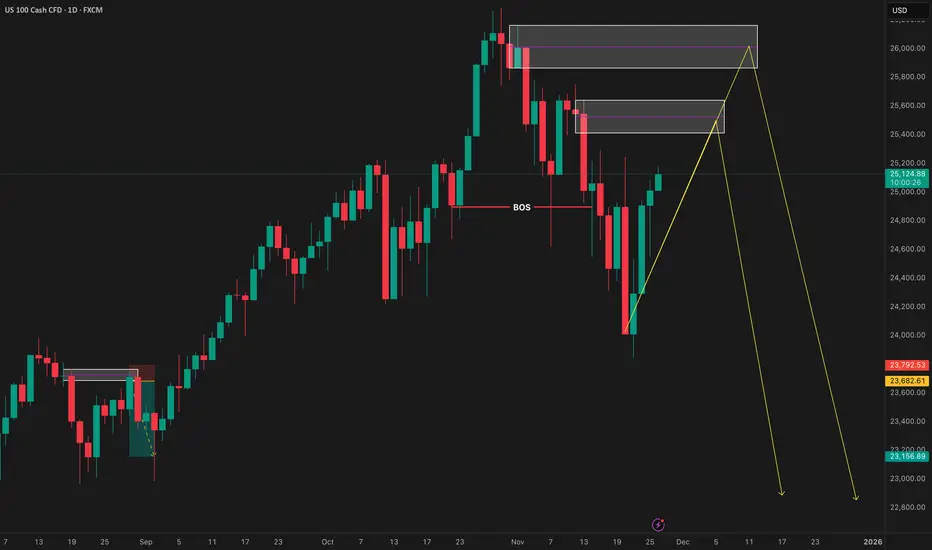
LOOKING TO SHORT NASNAS100 1D - For those of you who like to trade this CFD, I am wanting to see price continue trading us lower as the Dollar weakens over the course of the next month or so.
We will however see some temporary strength whether it be for the next week or two. However my overall bias for this market is to see it trade us lower longer term.
We have been delivered with multiple breaks in structure to the downside suggesting bearish momentum, its now a case of waiting for the opportunity to play into our hands before we take part.
As soon as price gives us the structure we need, the penetration of areas of interest this is when we can begin looking to take part, until then we stay patient, as always.
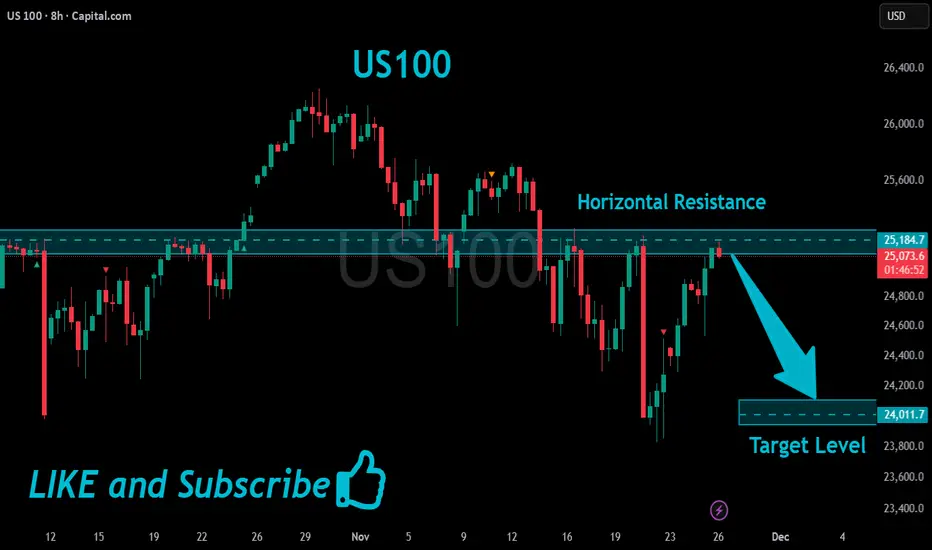
US100 Will Go Down!
HI,Traders !
#US100 already made a retest
Of the horizontal resistance
Of 25184.7 from where we
Are seeing a bearish reaction
And we will be expecting a
Further bearish move down !
Comment and subscribe to help us grow !
USNAS100 Continue within a bearish trendBitcoin continued its consolidation within a bearish trend as the world’s largest cryptocurrency by market capitalization extended its decline on Monday, with broader risk-off sentiment weighing on markets at the start of December.
Prices fell more than 6% during overnight trading and were quoted just above the 85,000 level early Monday morning on the U.S. East Coast.
Bitcoin has maintained a bearish structure since May, when price action briefly tested resistance near 89K before turning lower again. Downside pressure remains as long as price stays below that resistance zone, with key support levels expected around 83K to 80K
You may find more details in the chart,
Trade wisely best of luck buddies.
Ps; Support with like and comments for better analysis thanks for supporting.

Nas Perspective Based on how Nasdaq is playing around withing the 30- and 15-minutes range it gives a strong signal of an upcoming strong expansion. with this idea it is much safer to trade it once it breaks out of the accumulation range. Alot of factors are playing part and will contribute to the expansion of price, expected the beginning of DECEMBER 2025 . Trading wise, I would be marking my ranges off one 15 minute candle or off 5 minutes ranges, mostly targeting Longs.

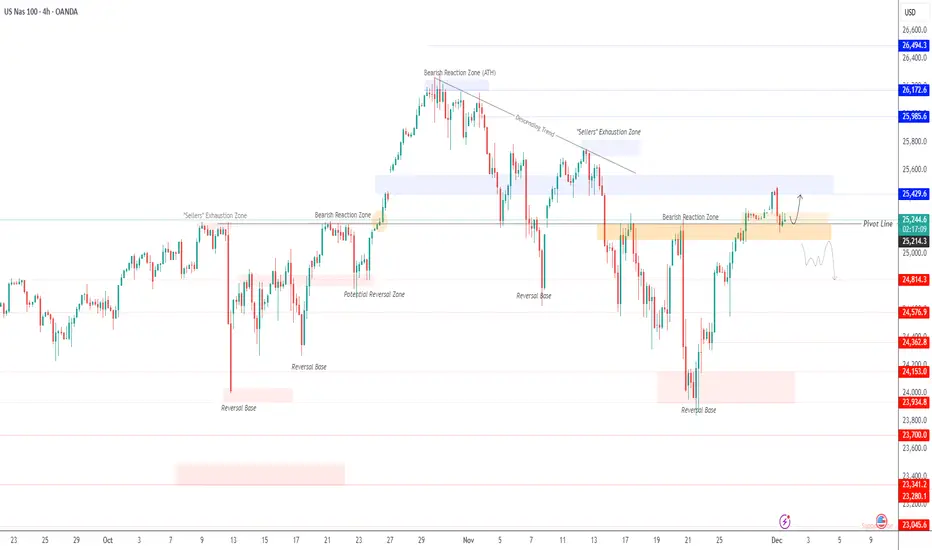
USNAS100: 24760–24880 Range Controlling the MarketUSNAS100 | Technical Overview
U.S. stock index futures slipped slightly on Tuesday, cooling after a strong tech-led rally in the previous session.
Investors remain cautious as they await upcoming economic data and earnings releases that will offer clearer signals on the strength of U.S. consumer spending and overall market resilience.
Technical Outlook
The Nasdaq is currently consolidating between 24760 and 24880, awaiting a decisive breakout.
Bearish Scenario:
A 1H close below 24760 will activate a bearish leg toward 24575, and a break below that level opens the way toward 24365 and potentially 24150.
Bullish Scenario:
A 1H close above 24910 will confirm bullish continuation toward 25210, with further upside potential toward 25420.
Pivot Line: 24760
Support: 24575 · 24365 · 24150
Resistance: 25210 · 25420


USNAS100 | Breakout Setup Ahead of PowellOANDA:NAS100USD – Outlook
Wall Street futures slipped on Monday as investors turned cautious ahead of key U.S. economic data and remarks from Federal Reserve Chair Jerome Powell later in the day.
Market participants will closely analyze Powell’s comments for any hints regarding the Fed’s stance on potential rate cuts at this month’s policy meeting.
Technical Analysis
NASDAQ is trading inside a consolidation range between 25200 and 25290, showing a slightly bullish bias while holding above 25200.
A 1H close above 25290 will confirm bullish continuation toward 25430, and a breakout above 25560 opens the path for an extended rally toward 25980.
On the downside, a 1H close below 25200 will expose 25100, and a break below this level will trigger stronger bearish momentum toward 24810 → 24570.
Pivot Line: 25200
Support: 25100 · 24820 · 24570
Resistance: 25300 · 25420 · 25560
NAS100 I Potential break of 25,217 Resistance Welcome back! Let me know your thoughts in the comments!
** NAS100 Analysis - Listen to video!
We recommend that you keep this on your watch list and enter when the entry criteria of your strategy is met.
Please support this idea with a LIKE and COMMENT if you find it useful and Click "Follow" on our profile if you'd like these trade ideas delivered straight to your email in the future.
Thanks for your continued support!

USNAS100 📉 The US100 chart shows a strong bullish structure forming after price successfully broke above a long-term descending trendline that had been acting as resistance for several weeks. This breakout indicates a potential shift in market momentum from bearish to bullish. After the breakout, price retested the same zone, confirming it as new support, which strengthens the reliability of the bullish setup.
✅ We can also see two major demand zones marked on the chart. These zones have repeatedly pushed price upward in the past, showing strong buying pressure. The market respected the latest demand zone once again, creating a solid base for the current upside move. With buyers stepping in and defending this level, a continuation to the upside becomes more likely.
✅ Following the retest of the broken trendline and the demand area, the price has started forming higher highs and higher lows—an early sign of trend reversal. This bullish structure aligns perfectly with the upward projection shown on the chart. The first target is placed around 25,700, where previous minor resistance lies. If price manages to break this level with momentum, the rally could extend toward the second target near 26,000+, which is a stronger resistance area and a psychological level where traders often take profits.
✅ The stop-loss region is positioned below the retest zone to protect the trade in case price fails to hold above the new support. This ensures a balanced risk-to-reward setup while maintaining market structure integrity.
✅ Overall, the market setup suggests a well-defined bullish opportunity supported by trendline breakout, successful retest, strong demand zones, and improving price structure. As long as price stays above the retest level, buyers may continue to push toward the highlighted targets.
If you find it helpful please like and comments for this post and share thanks.
