correlation between the yield curve and the unemployment rate correlation between the yield curve and the unemployment rate
Trade ideas

US bond market is yelling Crash coming!US02y/US10y suggesting a change on the trend pretty soon. Last two times MACD was this close to visit the 0 line It took about 120 days to start the crash in 2007 and less than 30 days in 2020. It is just a matter of time folks. Pain is close

What if bonds are kinda important?Lets draw few parallel lines. Looks like cross of green supports shows start of the party and crossing red resistances means music isn't playing anymore. Could be coincidence. Looks like green support is coming. If we pierce it could be bullish. Unfortunately this time is different because of inversion. We will see.

Bond markets pricing in a possible recessionary scenarioSpread between US 2 year yield and Fed Funds Rate is one of the key indidcators to watch out for the state of the economy. Fed Funds Rate is an overnight rate. Historically, before any recessionary scenarios the spread was seen moving to negative territory, during Middle East Crisis in 1989/1990, dotcom crisis in 2000/2001 and Credit crisis in 2008.
Currently, the spread is at -1.67%, second lowest in history only to 2008 Credit crisis which was at -1.76%. This leads to a strong conclusion that the interest rate markets are possibly pricing in a recessionary scenario.
Interesting times ahead...

US02Y / US10Y Yield CurveThe Yield Curve has been inverted for a long time, and as rates are about to go lower, it can finally un-invert. When the 2-year yield is higher than the 10-year yield, the chart is above 1.0 ; But once the 2-year yield dips below 10-year yield, the chart should drop below the 1.0 mark.

us02Y(Mallicast)The U.S. two-year Treasury bonds, after reaching a yield of 5.093% and gathering liquidity, have begun to correct their previous upward trend. This correction is expected to continue until it reaches 3.555%, with the possibility of further correction down to 2.832%.

us02Y (Mallicast analysis)The U.S. two-year Treasury bonds, after reaching a yield of 5.093% and gathering liquidity, have begun to correct their previous upward trend. This correction is expected to continue until it reaches 3.555%, with the possibility of further correction down to 2.832%.

Yield ChartThis chart tracks U.S. Treasury yields for 2-year (blue), 10-year (white), and 30-year (orange) bonds, along with the yield spread (green) between the 10-year and 2-year bonds. A positive spread suggests a normal yield curve and economic growth, while a negative spread (inversion) often signals a potential recession.


getting close to yield un-inversion 2Y is warming up for un-inversion , looks like more pain to come ahead for SPX

2 Year yields are weakeningWhich often signals a incoming recession.
The market leads the #FED who always raise and lower rates too late.
We have #Unemployment starting to tick up
Tight financial conditions, delinquencies on the rise.
So make hay over the next few months in memestocks, coins, bitcoin, alts, NVDA and so on.
But don't be left holding the hot potato when the music stops playings.
#Macro
#Meltup
#NVDA
#Nasdaq
#Stocks
#Bitcoin
#Altcoins
#Ethereum
#Pulsechain

2 Year US Treasury Yield going down2 Year US Treasury Yield going down.
2 Year US Treasury Yield is always the first one to go down, few months before the Federal Reserve starts cutting rates.
Hold 2 Year US Treasuries to capitalize on it. (Yield down, Bond price up)

T-notes Interest rate vs its future pricingIt's Inverse relation. An increasing interest rate will drive down the future's price.

$US02Y $US10Y $GLD $IVOL $TLT - The Chart tells the futureHere we have a historical chart showing what will likely be obvious in 2 quarters. The chart bats 100% on the issue but not on the resolution. As you can see with LTCM and the Bhat crisis in the late 90s. This chart is great for signaling when to risk-off, it does not signal risk on, for that I use the CBOE:BXY . The way I play the waiting game after going risk off is exposure to AMEX:IVOL NASDAQ:IEF AMEX:GLD NASDAQ:TLT AMEX:UUP
Cheers,

We are close folks. 2 year bond market close to shift to a downtrend that could be trigger a major correction on spy . Recession time ahead folks


Can higher projected US02Y impact GOLD price ?TVC:US02Y has been trading to attractive levels fibonacci levels of 50% resulting in formation of bullish flag. Price is projected to go to 5.5% according to flag pattern. Recent NFP had higher than expected unemployment claims. Will this scenario attract investors to buy more bongs ?
What do you think will be impact of bullish bonds yield to the price of GOLD ?

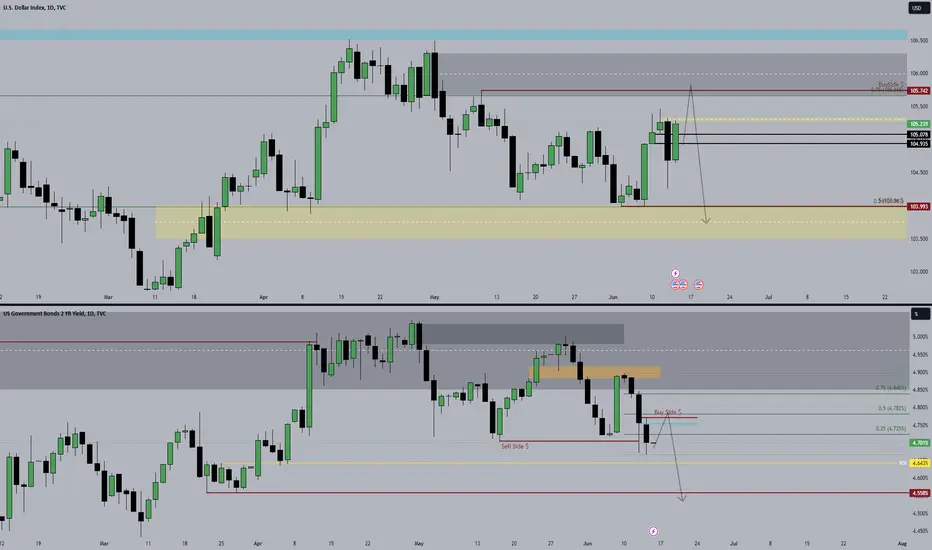
*SMC* DXY correlated with US02Y Bonds As we can see on the daily tf, DXY has created Relative Equal High at 105.459 which translate to this level being a liquidity pool. We are likely to see 105.459 being taken out put where can it go? As we can see, above 105.459, the closer PDArray is the OrderBlock (made the 30 Apr) which confluate with the 75% of the Dealing Range and another buyside liquidity pool at 105.742. I dont expect DXY to trade above the mean threshold of the OrderBlock and if it touched I expect a strong reaction to the downside.
Concerning the 02 year Bonds , the body has respected the OrderBlock (30 Apr) creating relative equal low which has been taken out (june 12). There is a ''crack'' in correlation right now between the DXY and the major Bonds of the US which leads me to think that there is a higher probability for the DXY to follow the Bound and drop lower.
Fundamentally, Powell has been pointing out the progress that has been made (which could eventually lead to a cut of rates) However, the ''Dot Plot' ' surprised the market of a likely to only 1 cut this year instead of 2-3 rate cut priced-in, which could be the reason why DXY has been going higher the last couple of days.
Yields are still selling off after yesterday's dropLet's see how the TVC:VIX does over the next few days/weeks.
Still think it eventually breaks its major support level, at least temporarily.
The 2Yr and 10Yr are crashing and following yesterdays drop. TVC:TNX
#interestrates, as we said, will likely be cut, even if a little. They will most likely be raised again next year. Not political...
Anyway, since we have stated COUNTLESS times. They CANNOT lower rates but MUST lower them.

2Y yield - 45 degrees, break-outs and break-downs. Using 45 degree angles for 2Y yield (or inflation barometer) and stock market (faang). Pretty useful.
Bolts show where break downs of inflation are and where inflation is rising.
45 degrees show the strongest trend. You dont even need to use RSI. all must equal

Bond Yields about to crater?GOOD MORNING!
The 2Yr & 10Yr have broken the triangle pattern we posted on long ago.
The TVC:TNX (10Yr) has gone lower compared to the 2Yr in the same time frame.
Again, natural normalization is still out the window! What does this point to?
Will fed do what they are good at & mess it up again?
---
Now look @ the 10Yr on a weekly chart!
AH HA! Are Bond #yields about to crater???

Stock Market Going DownStock Market is going down...
2 Year treasury is heading down
Nonfarm Payrolls are heading down
Unemployment rate is heading up
SPY looks like it's topping out
NASDAQ:TLT AMEX:TMF

Yields - Bullish - First Week of June 2024smt at lows + respect of bullish fair value. Anticipating completion of MMBM
