Trade ideas

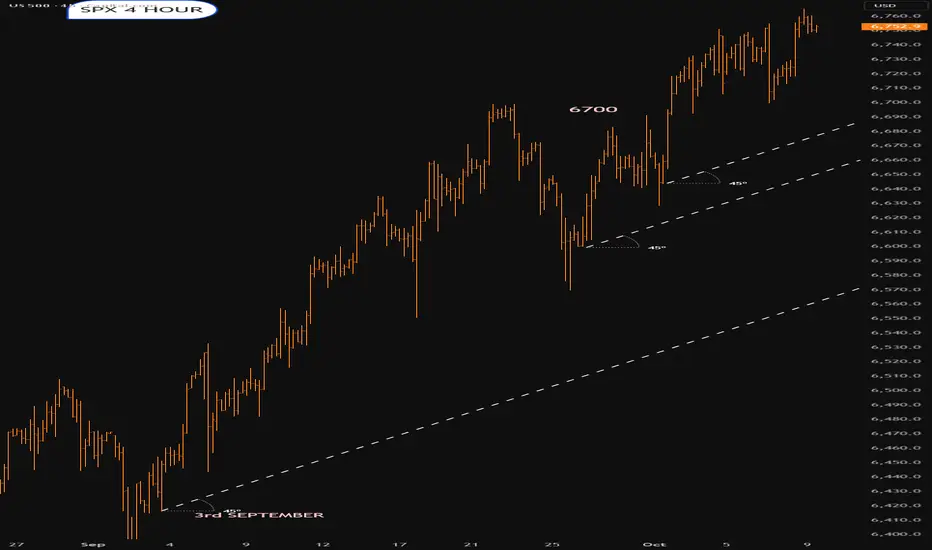
S&P 500 Watching 6,700 Support as Seasonal Tailwinds Strengthen.Hey Traders,
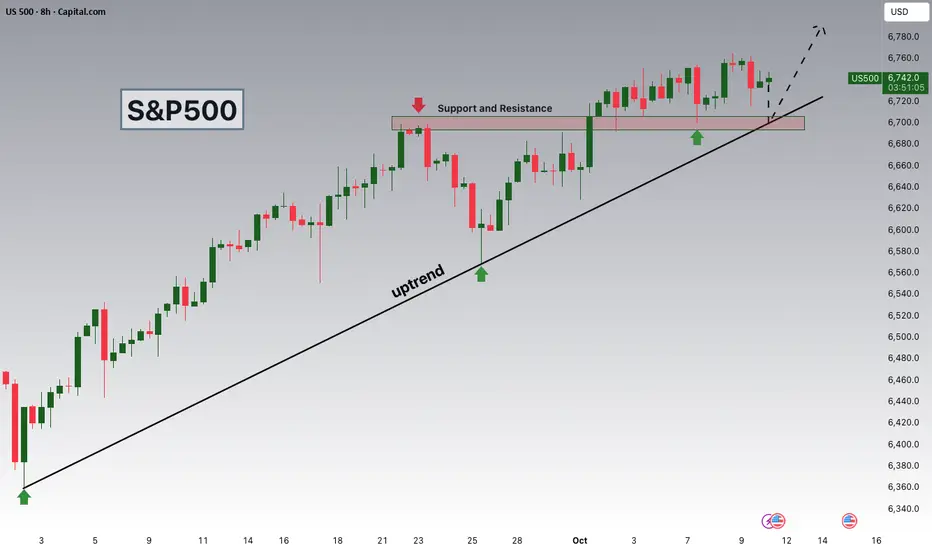
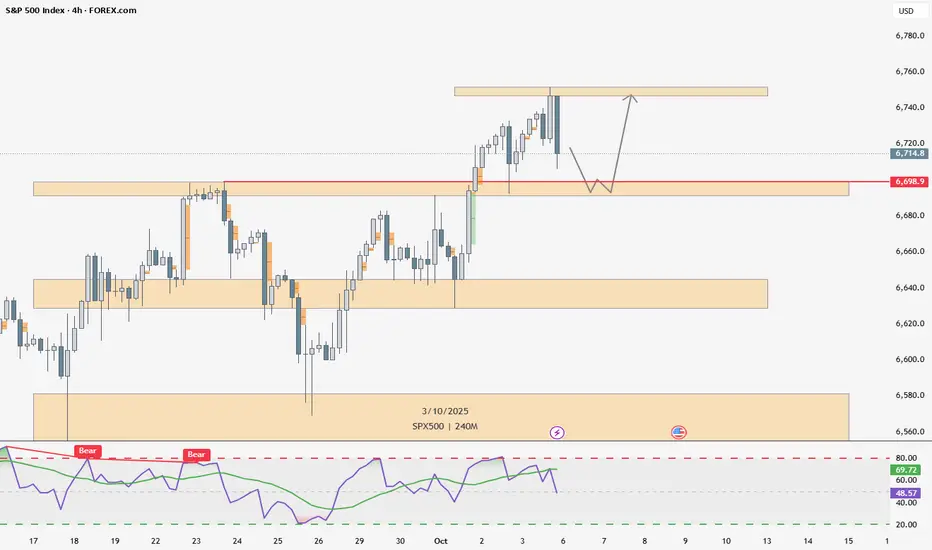
In today’s session, we’re keeping a close eye on US500 for a potential buying opportunity around the 6,700 zone. The S&P 500 remains firmly in an uptrend, with price currently in a healthy correction phase approaching a key support and trend confluence near 6,700.
Beyond the technical setup, seasonality adds a bullish layer — over the past 15 years, the S&P 500 has advanced 14 times in October to early November, averaging significant gain during this window.
If history rhymes, the current pullback could offer a compelling buy-the-dip opportunity into one of the market’s strongest seasonal periods.
Trade safe,
Joe.
SPX500USD 4H – Bullish Continuation SetupThe market continues to maintain an upward structure, with price consolidating just below the 6,770.00 resistance area. This zone remains key for buyers looking to confirm a continuation toward the next target at 6,830.74.
Support at: 6,700.00 /6,647.95/6,585.00 🔽
Resistance at: 6,770.00 / 6,830.74 🔼
🔎 Bias:
🔼 Bullish: A strong 4H close above 6,770.00 would likely extend the bullish move toward 6,830.74, continuing the broader uptrend.
🔽 Bearish: Rejection from 6,770.00 and a break below 6,700.00 could lead to a pullback around 6,647.95 and even a deeper pullback toward 6,585.00.
📛 Disclaimer: This is not financial advice. Trade at your own risk.

SPX500 – Futures Rebound Amid Shutdown Uncertainty and AI RepricSPX500 – Overview | Futures Rebound After Market Pullback
U.S. stock futures edged higher on Friday after the S&P 500 and Nasdaq Composite retreated from record highs.
Investors are re-evaluating the AI-driven rally, rate-cut expectations, and the ongoing government shutdown, now entering its ninth day.
The shutdown’s continuation delays key U.S. economic data releases, increasing uncertainty around the Federal Reserve’s policy outlook.
Technical Outlook
The price tested its support zone and rebounded, but momentum remains mixed.
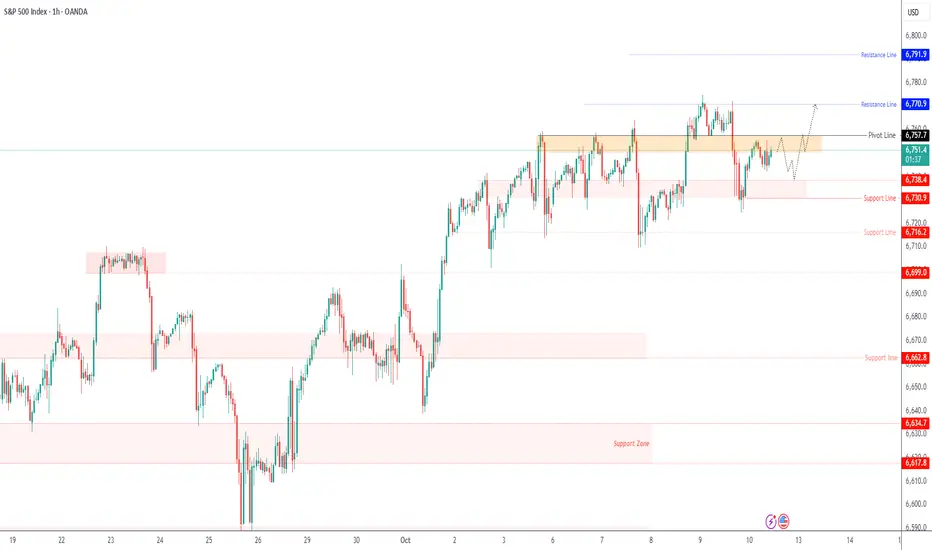
To confirm renewed bullish strength, SPX500 must break above 6,757, which would open the way toward 6,770 → 6,791.
As long as the price trades below 6,757, short-term bearish pressure may persist toward 6,738 → 6,730.
A confirmed break below 6,730 would extend the correction toward 6,716 and signal further downside potential.
Pivot Line: 6,757
Resistance: 6,770 · 6,791
Support: 6,738 · 6,730 · 6,716
Summary:
SPX500 is consolidating after the pullback, with near-term bias depending on a break of 6,757 or 6,730.
Traders should expect volatility as the shutdown drags on and the market reassesses Fed policy expectations.
Global IPO Trends and the Rise of SME ListingsSection 1: Understanding IPOs in the Global Context
An Initial Public Offering (IPO) represents a company’s transition from private ownership to public trading on a recognized stock exchange. It allows businesses to raise funds from institutional and retail investors while providing liquidity for existing shareholders.
Over the past decade, IPO markets have evolved significantly, with technology-driven platforms, regulatory modernization, and global cross-listings simplifying the process. The increasing participation of retail investors, coupled with innovations like fractional investing, has made IPO participation more inclusive.
However, IPO performance tends to mirror global macroeconomic cycles. When markets are buoyant and investor confidence is high, IPO volumes surge. Conversely, during economic uncertainty or tightening monetary policies, new listings decline. This cyclical nature of IPOs underlines their sensitivity to interest rates, inflation, geopolitical risks, and currency fluctuations.
Section 2: The Changing Dynamics of Global IPO Markets
Between 2020 and 2025, the global IPO landscape underwent significant structural shifts:
Technology and Digitalization:
Technology firms, particularly in fintech, AI, and green tech, have led the IPO wave. Digital-first business models have attracted investors seeking growth and innovation, especially post-pandemic.
Sustainability and ESG Focus:
Environmental, Social, and Governance (ESG) principles now influence investment decisions. Companies emphasizing sustainability and ethical governance tend to receive higher valuations and investor trust during IPOs.
Regional Diversification:
While the U.S. and China remain major IPO hubs, emerging markets — especially India, Southeast Asia, and the Middle East — are seeing record IPO activity. These regions offer young demographics, digital penetration, and pro-market reforms that make them attractive IPO destinations.
Rise of Cross-Border Listings:
Globalization has encouraged companies to list in multiple markets. Dual listings in exchanges such as NASDAQ, LSE, and Hong Kong have become common for firms seeking both capital and global visibility.
Private Market Maturity:
The rise of venture capital and private equity funding means startups are staying private longer. However, once they mature, IPOs remain the ultimate exit route, offering liquidity to early investors and founders.
Section 3: SME Listings — The New Engine of Global Growth
Traditionally, IPOs were dominated by large corporations, but the past few years have witnessed a paradigm shift. Small and Medium Enterprises (SMEs) are increasingly leveraging IPOs to raise capital, particularly in emerging economies.
The SME segment forms the backbone of most economies — accounting for nearly 90% of businesses and 70% of employment globally. Despite their economic importance, SMEs often face funding constraints due to limited access to credit, high collateral demands, and lack of investor visibility. The introduction of dedicated SME boards on stock exchanges has changed this dynamic.
What Are SME Listings?
SME listings refer to the inclusion of smaller companies on specialized stock market platforms designed to accommodate their size, scale, and compliance capabilities. Examples include:
NSE Emerge and BSE SME in India
AIM (Alternative Investment Market) in the UK
TSX Venture Exchange in Canada
Catalist in Singapore
GEM Board in Hong Kong
These platforms feature simplified listing requirements, lower costs, and flexible regulatory frameworks, encouraging smaller businesses to go public.
Section 4: Why SMEs Are Choosing to Go Public
The surge in SME IPOs globally is not accidental. Several factors drive this movement:
Access to Growth Capital:
IPOs offer SMEs a cost-effective way to raise long-term funds without heavy reliance on debt. This capital supports business expansion, technology upgrades, and international market entry.
Enhanced Visibility and Credibility:
Being listed on an exchange elevates a company’s market reputation, improving its brand image and investor confidence. It also attracts strategic partnerships and new business opportunities.
Liquidity for Founders and Early Investors:
Listing enables founders and early investors to partially exit or monetize their holdings, creating a transparent valuation benchmark.
Employee Motivation:
Stock options and employee shareholding plans become attractive tools for talent retention and motivation post-listing.
Corporate Governance and Transparency:
IPO-bound SMEs adopt structured governance models, enhancing long-term sustainability and investor trust.
Section 5: Regional Spotlight – SME IPO Growth Around the World
India: A Model of SME Capitalism
India has emerged as one of the fastest-growing SME IPO markets globally. Platforms like BSE SME and NSE Emerge have listed over 500+ companies since inception, many of which graduated to the main board due to strong performance. Sectors like manufacturing, logistics, IT, and renewable energy dominate the Indian SME IPO space. The government’s Startup India and Make in India initiatives have further boosted investor participation.
United Kingdom: AIM’s Success Story
The Alternative Investment Market (AIM) in London remains one of the world’s most successful SME-focused exchanges. It provides flexibility in governance and attracts high-growth businesses from multiple geographies. AIM’s success proves that small-cap listings can thrive in a well-regulated, investor-friendly environment.
Asia-Pacific and the Middle East
Singapore’s Catalist and Hong Kong’s GEM Board have been pivotal in integrating smaller Asian enterprises into global capital markets. Meanwhile, Saudi Arabia’s Nomu platform is fostering regional SME listings as part of its Vision 2030 diversification strategy.
North America
The TSX Venture Exchange in Canada continues to be a leading platform for SME and resource-sector listings, attracting mining, energy, and tech firms. The NASDAQ First North in Europe serves similar purposes for innovative startups.
Section 6: Global Investor Appetite for SME IPOs
Investors are increasingly viewing SME IPOs as high-risk, high-reward opportunities. While large IPOs offer stability and liquidity, SME IPOs promise agility, innovation, and rapid scalability.
Institutional investors, venture funds, and family offices are diversifying their portfolios by allocating portions to SME IPOs, especially in growth markets like India, Indonesia, and Vietnam. Retail investors are also participating, aided by digital platforms, online brokerage access, and financial literacy initiatives.
However, due diligence is crucial. While some SME IPOs deliver multi-bagger returns, others may face post-listing volatility due to limited trading volumes or governance challenges. Therefore, risk management and portfolio diversification remain key.
Section 7: Challenges in the SME IPO Ecosystem
Despite impressive growth, SME listings face several obstacles:
Limited Analyst Coverage: Smaller companies often lack research visibility, making investor evaluation difficult.
Liquidity Constraints: Lower market capitalization can lead to thin trading volumes.
Regulatory Compliance Costs: Even simplified processes can be burdensome for micro-enterprises.
Investor Education Gaps: Retail investors may underestimate the risks associated with early-stage public offerings.
Addressing these challenges through regulatory support, investor awareness, and digital tools can significantly strengthen the global SME IPO ecosystem.
Section 8: The Future of Global IPO and SME Listings
Looking ahead, several trends are expected to define the future of IPOs and SME listings:
Digital IPO Platforms:
Blockchain-based and AI-enabled IPO mechanisms are simplifying subscription and allocation processes, making listings faster and more transparent.
Green and Impact IPOs:
Environmentally sustainable SMEs will dominate future IPO pipelines, aligning with global ESG priorities.
Decentralized Capital Raising:
Tokenized equity and digital securities might become alternatives to traditional IPO structures.
Global SME Integration:
Cross-border SME listings could become commonplace as global investors seek early exposure to emerging market innovation.
Government Incentives:
Many countries are now offering tax incentives and funding support for SMEs planning to go public — an encouraging sign for sustained IPO growth.
Conclusion: Democratizing Capital Through Global IPOs
The evolution of global IPO markets, coupled with the rise of SME listings, represents a fundamental shift in how businesses access capital and how investors discover value. IPOs are no longer the domain of corporate giants alone — they are becoming the growth engine for millions of SMEs worldwide.
As regulatory frameworks evolve and investor interest deepens, the democratization of finance will accelerate. From New York to Mumbai, London to Singapore, IPO platforms are empowering smaller businesses to dream bigger and compete globally.
In this new era of public offerings, innovation, transparency, and inclusivity are redefining the global capital landscape — making the IPO market not just a financial milestone but a symbol of global economic transformation.
If the market wants to go up, we followThe US500 is breaking the resistance level and trading to new highs. We have to remind ourselves that we are not here to predict, but rather to follow the market. The market is breaking higher, and thus we follow.
For this trade, likely best to just use a trailing stop loss using either a 2-day low price, or ATRx2 trailing stop loss.

Trendlines are one of the strongest indicators in technical analTrendlines are one of the strongest indicators in technical analysis. When we reach trendlines, it indicates something is about to happen, typically a consolidation and then either a breakout or a breakdown.
This is the weekly chart for the S&P 500, going back to 2018. The S&P is a strong gauge of the market’s health as it has a broad swath of companies and industries in comparison to smaller indices like the Nasdaq (tech) or the Dow Jones (a very small, select group of best performers). Additionally, the entire globe's indices tend to follow the S&P.
This chart shows 1-week candles dating back to 2018, where we saw the initial resistance trend we are bumping against now established. We are now testing it a third time after testing a bottom three different times, the last time exhaustively consolidating at the bottom before picking back up. The longer we consolidate at a trendline, the more chance there is for it to break down.
In our case now, if we continue up and break out of this 7-year trendline, it is a strong indicator that the stock market is about to break out even more, possibly establishing our old resistance as the new support line and reaching for unseasonably new highs.
Alternatively, if this resistance trendline holds as it has before, the S&P could easily lose 1,500 points while staying in range of its current trend.
If you are invested in equities and trying to decide whether to put more money in or move some of your investment dollars into something else in the near future, you should be paying attention to this chart!
Another thing to consider is the price of Gold, its up from $2400 to $4000 this year. Gold has definitely broke out and with no sign of weakness currently. Gold typicaly rises in price when the economic outlook is concerning to investors, as an attempt to safe haven some of their wealth. Usually when gold rises like this, the market has been dumping, not running. Mixed signals make it difficult read the coffee grounds, be vigilant and ready to react.

S&P500 fresh all time highUS equities regained momentum yesterday, with the S&P 500 up 0.58% to a fresh all-time high as investors shrugged off political uncertainty and the ongoing government shutdown. The broader risk-on tone was supported by strong global sentiment, easing bond yields, and renewed optimism across multiple asset classes.
Key drivers:
Political backdrop: Despite the US shutdown and political noise in France, markets focused on stability signals — notably President Macron’s decision to delay a snap election by pledging a new prime minister.
Global rally: Equities, bonds, oil, and gold all moved higher, reflecting a broad-based risk appetite. Gold hit a record $4,042/oz, suggesting some defensive hedging alongside equity strength.
AI momentum: The AI investment boom continued to fuel tech optimism, with Nvidia-backed startup N8n raising $180m at a $2.5bn valuation, underscoring ongoing enthusiasm around AI-linked growth.
Macro & policy: Investors largely looked past Washington gridlock, though air traffic disruptions and debate over furloughed workers’ pay added to the shutdown narrative.
Market tone:
Sentiment remains constructive for the S&P 500, with investors betting on resilient corporate earnings and continued AI-driven growth. However, elevated valuations and political uncertainty may temper further near-term upside.
Key Support and Resistance Levels
Resistance Level 1: 6768
Resistance Level 2: 7800
Resistance Level 3: 6820
Support Level 1: 6695
Support Level 2: 6672
Support Level 3: 6642
This communication is for informational purposes only and should not be viewed as any form of recommendation as to a particular course of action or as investment advice. It is not intended as an offer or solicitation for the purchase or sale of any financial instrument or as an official confirmation of any transaction. Opinions, estimates and assumptions expressed herein are made as of the date of this communication and are subject to change without notice. This communication has been prepared based upon information, including market prices, data and other information, believed to be reliable; however, Trade Nation does not warrant its completeness or accuracy. All market prices and market data contained in or attached to this communication are indicative and subject to change without notice.

SPX.Poss first signs of trouble6700 pivot area.If that breaks and then becomes resistance on the bounce.Possible bear trap there first
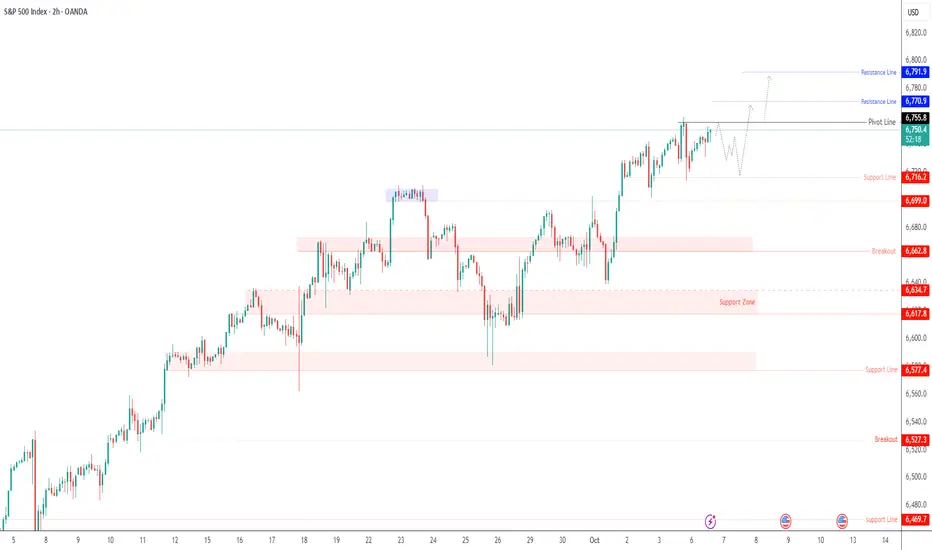
SPX500 Tests Highs as AI and Rate-Cut Hopes Support RallySPX500 – Technical Overview
The S&P 500 continues to trade near record highs as AI strength and renewed rate-cut optimism offset lingering concerns from the U.S. government shutdown.
Markets remain supported by expectations of further Fed easing, though volatility may persist around key resistance zones.
Technical Outlook
The index is testing the previous week’s highs around 6,755–6,727.
A 1H close below 6,727 would confirm a short-term bearish correction toward 6,699 → 6,662.
Conversely, a 1H close above 6,755 would reinforce bullish momentum and open the way toward 6,770 → 6,791 → 6,820.
Pivot: 6,755
Resistance: 6,770 – 6,791 – 6,820
Support: 6,727 – 6,716 – 6,699 – 6,662
SPX...Ya might want to tighten stopsLets see if that trend can continue.?
Looks overstretched.That does not mean it will get sold

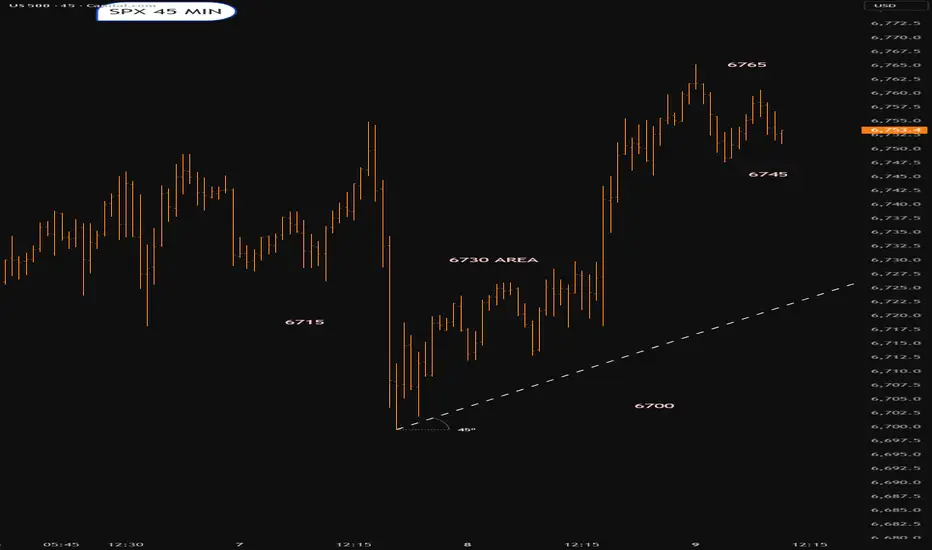
SPX into the open/ Thursday 9th OctoberWe could pop 6765 or we might even retrace to 6700-6715
Lets see what happens
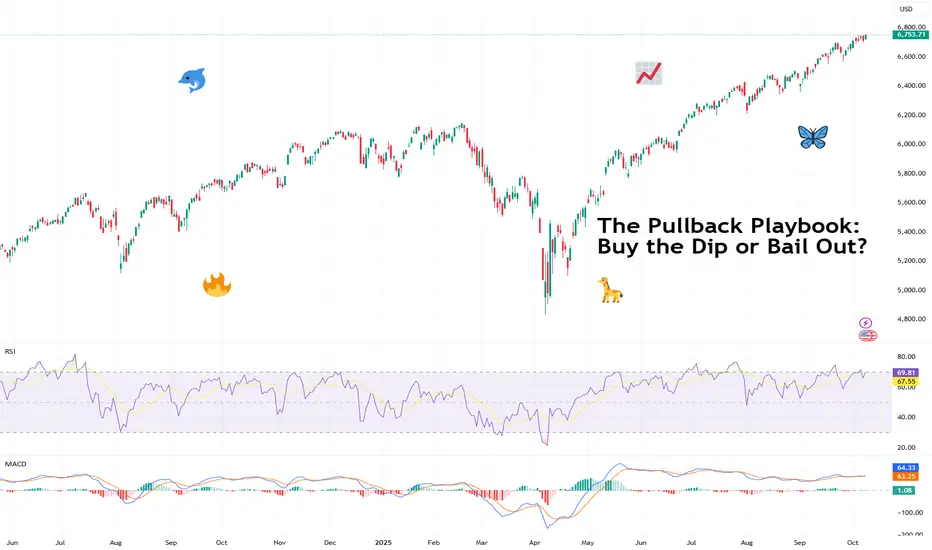
The Pullback Playbook: Buy the Dip or Bail Out?Markets don’t go up in straight lines. Even the strongest trends pause, retrace, and test your conviction.
These pauses are called pullbacks and they can either be healthy breathers before the next leg higher or the first cracks in a trend about to fall apart. The challenge for traders is knowing the difference.
📉 What Exactly Is a Pullback?
Think of a pullback as a temporary trend halt, not necessarily a crash. The price moves against the prevailing trend for a short period, testing support levels or shaking out weak hands before deciding where to go next. They’re common, normal, and — if managed right — they’re opportunities rather than threats.
But here’s where it gets tricky: not all pullbacks are trend halts. Some are the start of a flat-out reversal. And unless you’re comfortable holding through a potential nosedive, you need skills and tools to tell which is which.
🧐 Pullbacks vs. Trend Reversals
So how do know if you’re looking at a pullback or a trend reversal? The main differentiating factor is the length of the move. The healthy pullback looks orderly — modest in size, controlled in volume, and often retracing to familiar moving averages or support zones.
A healthy pullback might retrace 3-5% in a bull run, testing the 20- or 50-day moving average before bouncing higher.
A trend reversal barrels through multiple support levels in days, erasing weeks of gains. It’s often sharper, louder, and driven by news or panic.
Signs of a healthy pullback include:
• Price holding above key moving averages (20, 50-day. Some stretch to the 100-day but these tend to be rare — it’s more likely a trend reversal by then).
• Volume shrinking on the way down, then swelling on the rebound.
• Oscillators like RSI cooling off from overbought territory without plunging into oversold.
Trend reversals look more like:
• Breaks of multiple support levels in one go.
• Heavy, accelerating sell volume.
• Headlines driving panic: tariffs, central bank surprises, data releases from the Economic calendar , crypto exchange blowups, or noise coming from the Earnings calendar .
📊 Technical Tools to Judge the Dip
Charts can’t predict the future, but they can help you gauge probabilities. Pullbacks often line up with Fibonacci retracements, moving averages, or horizontal support and resistance levels.
• Moving Averages : If price pulls back to the 50-day and holds, that’s often a green light for trend continuation. If it slices straight through the 100-day? Not so healthy.
• Trendlines : Respecting the line = confidence. Breaking it = trouble.
• Volume : Low-volume pullbacks suggest sellers aren’t that committed. High-volume dumps are red flags.
None of these are crystal balls. But together, they give you a framework to avoid buying every dip.
🏄♂️ The Psychology of Buying the Dip
Why do traders love dips? Because everyone wants a discount. A pullback offers a chance to jump on a trend at a better price, and social media culture has turned “buy the dip” into a meme strategy. But memes don’t pay the bills when a dip turns into a crater.
The psychology works both ways:
• Optimists see dips as golden tickets.
• Pessimists see them as traps.
• Realists know both can be true, depending on the setup.
Being aware of your own bias — whether you lean toward buying too early or panicking too soon — is half the battle.
🔄 Asymmetric Risk and the Smart Bet
Here’s where it gets interesting. You don’t need to be right all the time if your risk-reward ratio is skewed in your favor. A tight stop and a wide target can mean one win cancels out several small losses.
Imagine risking 1% to potentially make 10%. Even if you’re wrong most of the time, the math can work. Pullbacks are prime territory for asymmetric setups: smart, thought-out entries, clear invalidation points (below support, trendline breaks), and attractive upside if the trend resumes.
This doesn’t mean chasing every dip. A pullback can wipe your position clean if you’ve placed your stop loss a little too close, a little too early.
⏳ Timing Matters
The biggest mistake with pullbacks is trying to catch the exact bottom. Traders love to brag about nailing the wick, but most who try end up paying for it. Smarter is to wait for confirmation — a bounce, a reversal candle, a break back above a short-term moving average.
Yes, you may miss the lowest price. But you’ll also miss buying into a freefall.
🌍 Pullbacks in Context
Context is everything. A dip in a raging bull market is not the same as a dip in a shaky sideways market. Macro matters too. If the Fed is cutting rates , risk assets might rebound fast. If tariffs, wars, or inflation are spiking, a pullback could turn into something bigger and deeper.
That’s why traders zoom out before diving in. Daily charts tell one story; weekly charts often tell the bigger tale.
🚀 Buy or Bail?
So, do you buy the dip or bail out? The honest answer is: it depends. A well-structured pullback in a strong uptrend with unchanged fundamentals is an opportunity.
A violent, volume-heavy selloff in a fragile market with cracked fundamentals is a warning.
The pullback dilemma isn’t just about charts but also about psychology. Can you hold your nerve when the market wobbles, or will you cut and run? Both choices can be right in the right context.
🎯 Final Takeaway
Pullbacks are part of every trend’s DNA. They test conviction, patience, and risk management. The key isn’t to predict every wiggle but to recognize whether price action is just cooling off or signaling something bigger.
Stay disciplined, respect your stops, and let the chart, not the noise, tell you when it’s time to stay in or step aside.
Off to you : Buy the dip? Or bail out? How do you respond to expected and unexpected market pauses? Let us know your coping mechanism in the comments!
US500 Breaks Out and Aims HigherUS500 Breaks Out and Aims Higher
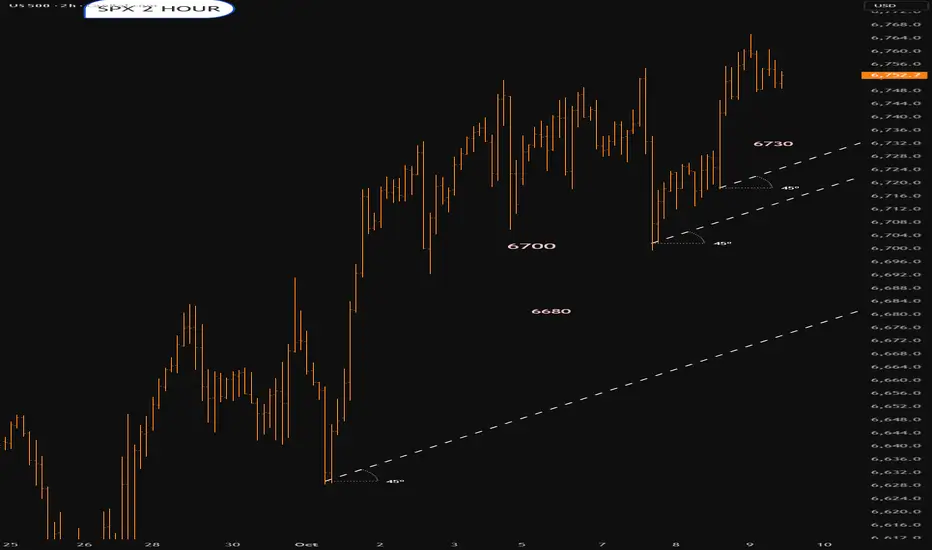
Since the start of October, the US500 has been moving inside a large bullish pattern, showing signs of accumulation. Now, it looks ready to rise again, supported by expectations that the FOMC will continue with its rate cut plans in the upcoming meetings.
The FOMC minutes released yesterday also confirmed support for a 25 bps rate cut, adding strength to market optimism.
Recently, the US500 broke out of the bullish pattern, suggesting more upside potential ahead.
For now, the next targets are around 6780 and 6800.
You may find more details in the chart!
Thank you and Good Luck!
❤️PS: Please support with a like or comment if you find this analysis useful for your trading day❤️

S&P 500 INDEX (US500): Bullish Signal!? As US500 Eyes New HighUpdate on 📈US500
A confirmed breakout above a significant daily resistance level was observed.
Subsequently, the market retested the breached structure and initiated consolidation within a narrow range on the 4-hour timeframe.
The range resistance was breached yesterday, which constitutes a strong intraday bullish signal.
Further upward movement may extend to the 6800 level.

US500 Remains BullishUS500 is currently near record levels. The index maintains robust overall performance, with monthly and yearly gains standing above +3.00% and +15%, respectively. This strength is fundamentally driven by broad based bullish sentiment, confidence in strong corporate results, and particularly the ongoing technology sector leadership and AI-related dealmaking, which recently propelled the index to new all-time highs.
Fundamental Analysis
The market's optimism is tempered by underlying caution. Persistent inflation in the services sector remains a key concern, fueling expectations that the Federal Reserve may be compelled to keep interest rates higher for longer, a factor that could limit short-term upside momentum. Despite this, the index's current technical posture remains positive.
Technical Analysis
From a technical perspective, the US500 is in a strong upward trend, but the index is showing signs of being overbought after its recent surge. The immediate key support level is noted at 6,570 points. Looking ahead expect the bullish momentum to continue in the medium term, targeting 6,805 as the next potential resistance milestone. Conversely, the index might enter a period of consolidation or retreat, with projections near 6,485 points and a possible longer-term below 6,000.

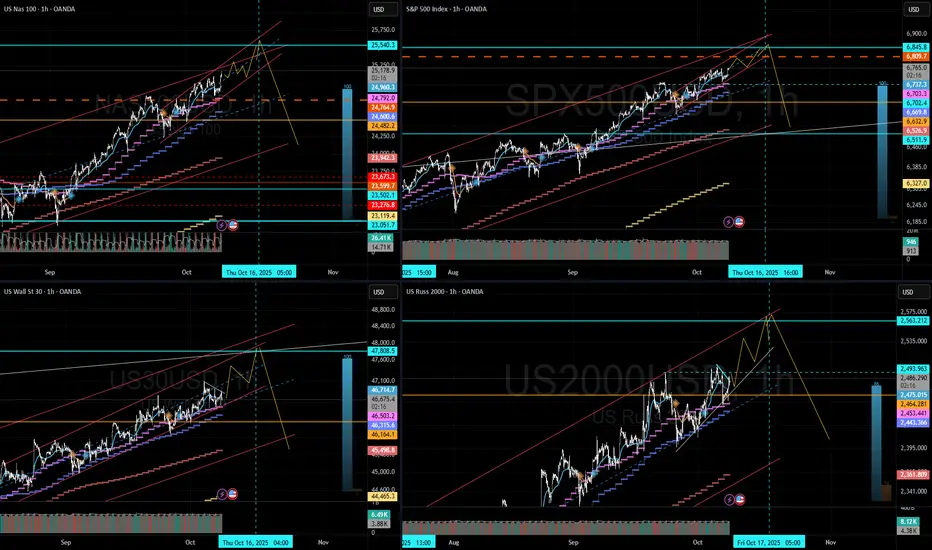
NAS, and all indices lining up for Oct. 17thOct. 17 Options Expiration could be a catalyst for a market correct higher degree Wave 2.
Or very close a few days after.
SPX500 Analysis SPX500 Analysis 📈
On the daily timeframe, SPX500 has broken the previous Higher High (6698.9), creating a new Break of Structure (BOS).
On the 4H chart, price is currently making a bearish retracement — I expect it could pull back into the demand zone between 6698.9 and 6691.4.
I’m waiting for confirmation to go long from that area,
with a target at the upper supply zone between 6751.8 and 6746.9
US500 SELL?Market has been bullish for a long time, and there seems to be a possible reversal on daily.
Based on 4HR TF, the market seems to be forming a possible reversal pattern which could lead to a possible reversal.
We could see SELLERS coming in strong should the current level hold.
Disclaimer:
Please be advised that the information presented on TradingView is solely intended for educational and informational purposes only.The analysis provided is based on my own view of the market. Please be reminded that you are solely responsible for the trading decisions on your account.
High-Risk Warning
Trading in foreign exchange on margin entails high risk and is not suitable for all investors. Past performance does not guarantee future results. In this case, the high degree of leverage can act both against you and in your favor

S&P 500 - Should I be getting in right now?Price continues higher, holding above both the 60-day and 250-day EMAs, but momentum is fading:
RSI + MACD divergence
Open interest down by 500k (CFTC report) - w/c 23rd September.
Shorts likely getting squeezed = price up, participation down.
Elliott Wave count suggests we're in the 5th wave of the 3rd impulse — still bullish, but a Wave 4 correction could be next.
📍 Key level to watch: 5,481 (re-entry into Wave 1 territory = count invalidation)

S&P 500 & the Presidential Cycle: Bear Market in 2026?The U.S. presidential cycle is a cyclical approach to the stock market suggesting that S&P 500 performance tends to follow a recurring pattern over the four years of a presidential term. This cycle reflects the relationship between political decisions, fiscal and monetary policy, and investor psychology.
Historically, the first year of the term (post-election) is marked by economic and fiscal adjustments, often accompanied by moderate gains. The second year, known as the “midterm year,” is usually more hesitant: markets tend to be volatile amid political uncertainty and potential unpopular reforms.
This second year of the presidential cycle is typically the weakest of the four and the most prone to a significant S&P 500 consolidation — corresponding in our case to the year 2026.
In contrast, the third year of the term almost always stands out as the most favorable for equities, as the administration seeks to boost growth ahead of the next election campaign, often through more accommodative fiscal or monetary measures. Finally, the fourth (election) year tends to remain positive on average, although performance often flattens as electoral uncertainty increases.
From this perspective, 2026 will mark the second year of Donald Trump’s presidential cycle — traditionally the most fragile for equity markets. From a technical standpoint, the S&P 500 has recently reached major resistance zones near its historical highs after a strong post-election rally. Several momentum indicators now show signs of exhaustion, while Shiller’s P/E ratio stands at historically elevated levels, indicating stretched valuations.
In this context, it is plausible that 2026 will bring a phase of consolidation for the S&P 500, or even a more pronounced correction. Institutional investors may adopt a more cautious stance, awaiting greater clarity on fiscal trajectories, Federal Reserve rate policy, and the impact of new government measures. This cooling phase would be natural after several years of sustained growth and could form a healthy foundation for the next bullish impulse, traditionally observed ahead of the pre-election year — 2027.
DISCLAIMER:
This content is intended for individuals who are familiar with financial markets and instruments and is for information purposes only. The presented idea (including market commentary, market data and observations) is not a work product of any research department of Swissquote or its affiliates. This material is intended to highlight market action and does not constitute investment, legal or tax advice. If you are a retail investor or lack experience in trading complex financial products, it is advisable to seek professional advice from licensed advisor before making any financial decisions.
This content is not intended to manipulate the market or encourage any specific financial behavior.
Swissquote makes no representation or warranty as to the quality, completeness, accuracy, comprehensiveness or non-infringement of such content. The views expressed are those of the consultant and are provided for educational purposes only. Any information provided relating to a product or market should not be construed as recommending an investment strategy or transaction. Past performance is not a guarantee of future results.
Swissquote and its employees and representatives shall in no event be held liable for any damages or losses arising directly or indirectly from decisions made on the basis of this content.
The use of any third-party brands or trademarks is for information only and does not imply endorsement by Swissquote, or that the trademark owner has authorised Swissquote to promote its products or services.
Swissquote is the marketing brand for the activities of Swissquote Bank Ltd (Switzerland) regulated by FINMA, Swissquote Capital Markets Limited regulated by CySEC (Cyprus), Swissquote Bank Europe SA (Luxembourg) regulated by the CSSF, Swissquote Ltd (UK) regulated by the FCA, Swissquote Financial Services (Malta) Ltd regulated by the Malta Financial Services Authority, Swissquote MEA Ltd. (UAE) regulated by the Dubai Financial Services Authority, Swissquote Pte Ltd (Singapore) regulated by the Monetary Authority of Singapore, Swissquote Asia Limited (Hong Kong) licensed by the Hong Kong Securities and Futures Commission (SFC) and Swissquote South Africa (Pty) Ltd supervised by the FSCA.
Products and services of Swissquote are only intended for those permitted to receive them under local law.
All investments carry a degree of risk. The risk of loss in trading or holding financial instruments can be substantial. The value of financial instruments, including but not limited to stocks, bonds, cryptocurrencies, and other assets, can fluctuate both upwards and downwards. There is a significant risk of financial loss when buying, selling, holding, staking, or investing in these instruments. SQBE makes no recommendations regarding any specific investment, transaction, or the use of any particular investment strategy.
CFDs are complex instruments and come with a high risk of losing money rapidly due to leverage. The vast majority of retail client accounts suffer capital losses when trading in CFDs. You should consider whether you understand how CFDs work and whether you can afford to take the high risk of losing your money.
Digital Assets are unregulated in most countries and consumer protection rules may not apply. As highly volatile speculative investments, Digital Assets are not suitable for investors without a high-risk tolerance. Make sure you understand each Digital Asset before you trade.
Cryptocurrencies are not considered legal tender in some jurisdictions and are subject to regulatory uncertainties.
The use of Internet-based systems can involve high risks, including, but not limited to, fraud, cyber-attacks, network and communication failures, as well as identity theft and phishing attacks related to crypto-assets.

American Financial Pulse: U.S. Markets Shape the Global Economy1. The Rise of U.S. Financial Dominance
After World War II, the world needed stability — and the United States provided it. The Bretton Woods Agreement (1944) established the U.S. dollar as the central pillar of the international monetary system. With the world’s gold reserves concentrated in America, other countries pegged their currencies to the dollar.
Even after the gold standard ended in 1971, the dollar’s dominance remained intact. U.S. financial markets grew deeper, more liquid, and more sophisticated than any other. Investors from around the world began to see U.S. Treasury securities as the safest asset, and corporations preferred raising funds through American capital markets.
By the 21st century, Wall Street had become the nerve center of global finance, home to some of the largest and most influential institutions — Goldman Sachs, JPMorgan Chase, Morgan Stanley, Citigroup, and others.
2. Wall Street: The Barometer of Global Sentiment
When the New York Stock Exchange (NYSE) or NASDAQ moves, the world pays attention. Wall Street’s performance often sets the tone for markets across Asia and Europe.
Bullish sentiment in the U.S. can lift markets worldwide, signaling economic optimism and boosting commodity prices.
Bearish or volatile trends, on the other hand, can spark global risk aversion, leading to sell-offs in emerging markets.
For instance:
The 2008 Global Financial Crisis, which started with the collapse of U.S. housing markets, triggered the worst worldwide recession since the Great Depression.
The tech boom of the 2010s, driven by Silicon Valley giants like Apple, Microsoft, and Amazon, created wealth and innovation ecosystems that influenced startups and stock markets globally.
In short, Wall Street isn’t just America’s financial hub — it’s the world’s emotional pulse of risk and reward.
3. The U.S. Dollar: The Global Reserve Currency
The U.S. dollar is the king of currencies — a symbol of trust, strength, and stability. Around 60% of global foreign exchange reserves are held in dollars, and most international trade and commodities (like oil and gold) are priced in USD.
This dominance gives the U.S. a unique “exorbitant privilege” — the ability to borrow cheaply, attract global capital, and wield financial sanctions effectively.
When the Federal Reserve raises or cuts interest rates, it doesn’t just affect the U.S. — it reshapes capital flows globally. A stronger dollar often leads to:
Capital outflows from emerging markets,
Currency depreciation in developing economies, and
Higher import costs for countries that rely on dollar-denominated trade.
Conversely, a weaker dollar can boost global liquidity and commodity prices, supporting international growth.
4. The Federal Reserve: The World’s Central Bank
The Federal Reserve (Fed) is not just America’s central bank — it’s the de facto central bank of the world.
Its policies on interest rates, inflation control, and money supply influence nearly every financial market globally. When the Fed tightens or loosens monetary policy, it sets off a chain reaction:
Bond yields shift across continents.
Exchange rates fluctuate.
Stock markets either rally or crash.
Take 2022–2023, for example: the Fed’s aggressive rate hikes to fight inflation caused global investors to flock to the dollar, leading to currency depreciation in Europe, India, and Japan. Developing nations faced capital outflows and rising borrowing costs, proving once again how America’s monetary policy reverberates worldwide.
5. U.S. Tech Giants and Their Global Economic Influence
Beyond monetary policy, corporate America also drives global trends. Tech companies such as Apple, Microsoft, Amazon, Google, Meta, and Tesla not only dominate U.S. indices like the NASDAQ but also shape global consumer behavior, innovation cycles, and investment trends.
Their market capitalization exceeds the GDP of many countries.
Global funds benchmark their performance against these companies.
Even non-U.S. economies depend on their supply chains and technologies.
For instance, Apple’s supply chain decisions in China or India influence local employment, manufacturing, and even government policy. Similarly, Tesla’s electric revolution has pushed automakers worldwide to accelerate their shift toward EVs.
These corporations make the American economy a key driver of global innovation and productivity.
6. The U.S. Bond Market: The Global Safe Haven
The U.S. Treasury market, valued at over $27 trillion, is the most liquid and trusted debt market in the world.
In times of global uncertainty — wars, pandemics, recessions — investors rush to buy U.S. bonds, driving up their prices and lowering yields. This phenomenon is known as a “flight to safety.”
For example:
During the COVID-19 pandemic, despite global chaos, demand for U.S. bonds surged.
Even amid geopolitical tensions like the Russia-Ukraine conflict, U.S. Treasuries remained the go-to safe asset.
This trust reinforces the U.S. government’s financial supremacy, allowing it to borrow at low rates and sustain high fiscal spending without immediate repercussions.
7. American Trade and Global Supply Chains
America’s financial strength isn’t just about Wall Street — it’s also about trade and consumer power. The U.S. is one of the largest importers and consumers in the world.
When American demand rises, exporters from China, India, Germany, and others benefit. When it slows, global trade suffers.
For instance:
The 2020–21 pandemic recovery in the U.S. boosted demand for goods, lifting export economies.
But slowing U.S. consumer spending in 2023–24 led to reduced factory orders worldwide.
Thus, the American consumer acts as the ultimate engine of global trade — their spending decisions echo through factories, ports, and currencies around the world.
8. U.S. Sanctions and Financial Power as a Tool of Diplomacy
One of the most significant, yet often overlooked, aspects of America’s financial influence is its ability to use economic sanctions as a form of global control.
Because the U.S. dollar dominates international transactions, most global banks and businesses rely on access to U.S. financial systems like SWIFT. When the U.S. imposes sanctions on countries like Iran, Russia, or Venezuela, it effectively isolates them from global finance.
This demonstrates the geo-financial power of America — the ability to influence political outcomes through control of money flow, rather than military force.
9. U.S. Market Crises and Global Shockwaves
History shows that financial turbulence in America often triggers worldwide crises:
1929: The Wall Street crash led to the Great Depression, spreading poverty and unemployment globally.
1987: Black Monday caused global stock market collapses within hours.
2008: The subprime mortgage meltdown triggered a global recession.
2020: The COVID-induced crash saw trillions wiped out globally within weeks.
Each time, recovery depended heavily on U.S. fiscal stimulus and Federal Reserve actions — highlighting both the risks and the resilience of America’s central role.
10. America’s Role in Emerging Market Dynamics
Emerging economies — such as India, Brazil, South Africa, and Indonesia — often experience boom-bust cycles tied to U.S. financial trends.
When U.S. interest rates are low, investors chase higher returns in emerging markets, driving asset prices up. But when the Fed tightens policy, capital retreats to the U.S., leaving these economies vulnerable to currency depreciation and inflation.
This cyclical dependency shows how America’s financial health acts as both an opportunity and a threat for developing nations.
11. The Future: Can the World De-Americanize Finance?
In recent years, there’s been growing talk of “de-dollarization” — the effort by countries like China, Russia, and members of BRICS to reduce dependence on the U.S. dollar.
While alternative payment systems and local-currency trade agreements are emerging, the U.S. still holds structural advantages:
Deep and transparent financial markets,
Strong legal systems,
Global investor trust, and
A culture of innovation.
Even as digital currencies and blockchain-based settlements evolve, the U.S. remains a central force in shaping the future of finance — through regulation, technological leadership, and institutional power.
12. Conclusion: The Unshakable Financial Pillar
America’s financial influence over the global market is a blend of trust, size, innovation, and history. Its currency drives trade, its markets dictate sentiment, and its policies shape growth trajectories worldwide.
From Wall Street traders to policymakers in Asia, from African commodity exporters to European bankers — all keep an eye on what happens in the United States.
While global diversification and regional powers continue to grow, the American financial system remains the spine of international economics. Its rhythm — whether fast or slow — continues to set the pace for the global financial symphony.
