SPX500 Local Short!SPX500 went up to
Retest the horizontal
Resistance level of 5313
From where we will be
Expecting a local
Move down!
US500.F trade ideas

SPX 5500My median Target for the SPX is still 5500. Using channels, Fibs, Elliot Wave, and volume colored bars I show where I believe the SPX is headed for next. It just needs some more fuel.. How it gets it I'm not sure I just know its destination. I also used TA to determine we are in fact still pointed up...
Remember...When things look bleakest that's when you should buy.

S&P500 Short-term accumulation before strong rise.The S&P500 index (SPX) has turned sideways since practically May 16 and, supported by the 1D MA50 (blue trend-line), is consolidating. Even though this consolidation is taking place at the top of the 1.5 year Channel Up (Fibonacci 0.0 - 0.236 range), it is similar in some way to the accumulation of April - May 2023 (also a little like November - December 2023), which was again supported by the 1D MA50.
As a result, as long as the price remains above the 1D MA100 (green trend-line), which provided the crucial Support on April 19 and started the recovery from the -6.65% decline, we expect a similar Channel Up to start when the accumulation ends. Our short-term Target is 5500 (top of 1.5 year Channel Up).
-------------------------------------------------------------------------------
** Please LIKE 👍, FOLLOW ✅, SHARE 🙌 and COMMENT ✍ if you enjoy this idea! Also share your ideas and charts in the comments section below! This is best way to keep it relevant, support us, keep the content here free and allow the idea to reach as many people as possible. **
-------------------------------------------------------------------------------
💸💸💸💸💸💸
👇 👇 👇 👇 👇 👇

The US500 is very interesting right nowThe index has made the abc correction I expected.
This is a necessary abc drop to start reaching new heights.
One of the most important things to understand when looking to buy various popular stocks. Also applies to Bitcoin.
PS this index is designed to go up forever, at least as long as we exist on this planet. Pure logical thinking.

Simple multitimeframe for US500, S&P 500 Index☝️Do not act based on my analysis, do your own research!!
The main purpose of my resources is free, actionable education for anyone who wants to learn trading and improve mental and technical trading skills. Learn from hundreds of videos and the real story of a particular trader, with all the mistakes and pain on the way to consistency. I'm always glad to discuss and answer questions. 🙌
☝️ALL ideas and videos here are for sharing my experience purposes only, not financial advice, NOT A SIGNAL. YOUR TRADES ARE YOUR COMPLETE RESPONSIBILITY. Everything here should be treated as a simulated, educational environment. Important disclaimer - this idea is just a possibility and my extremely subjective opinion. Do not act based on my analysis, do your own research!!

SPX500USD Will Move Lower! Sell!
Take a look at our analysis for SPX500USD.
Time Frame: 1D
Current Trend: Bearish
Sentiment: Overbought (based on 7-period RSI)
Forecast: Bearish
The price is testing a key resistance 5,294.3.
Taking into consideration the current market trend & overbought RSI, chances will be high to see a bearish movement to the downside at least to 5,215.6 level.
P.S
Please, note that an oversold/overbought condition can last for a long time, and therefore being oversold/overbought doesn't mean a price rally will come soon, or at all.
Like and subscribe and comment my ideas if you enjoy them!

Nvidia Drives S&P 500 Market Cap Surge with 36% ContributionThe price has reached our target, as mentioned yesterday, with a gain of +1.20%, approximately $60.
The SPX has recorded a new all-time high and continues to gain. It may retest down to 5347 before pushing up to 5378.
Overall, it could potentially reach 5320 if it stabilizes below 5347. As long as it trades above 5320, an uptrend towards 5423 is expected.
Bullish Scenario: If the price trades above 5347, it will continue its bullish trend toward 5378, and above that, it could reach 5423.
Bearish Scenario: If it stabilizes below 5347, it may drop to 5320. Stabilizing below 5320 on a 1-hour candle could lead to a decline to 5301.
Pivot Line: 5347
Resistance Lines: 5378, 5400, 5423
Support Lines: 5320, 5302, 5260
The price is expected to move between the support level of 5320 and the resistance level of 5423.
previous idea:
Nvidia Drives S&P 500 Market Cap Surge with 36% Contribution in 2024
Shares of US-based chipmaker Nvidia Inc. have had a stellar 2024, soaring nearly 150% and reaching new all-time highs. This impressive performance has significantly contributed to the $4.49 trillion (12%) increase in the S&P 500’s market capitalization, which now stands at $47.16 trillion.
Nvidia’s remarkable gains have been a major driving force behind the S&P 500’s record-breaking achievements. The chipmaker's contribution alone accounts for 36% of the index’s market cap surge this year, highlighting its pivotal role in the broader market’s upward trajectory.
In addition to Nvidia's impact, the S&P 500 has been bolstered by favorable economic indicators, including cooling jobs data, which has alleviated some inflationary pressures and supported continued market growth.
As the S&P 500 hits new records, Nvidia's milestone of reaching a $3 trillion market cap underscores the significant influence of leading tech companies in shaping market trends and driving substantial gains across the board.

Bearish Divergences everywhere part 2 Global indices are are not supporting this recent break to new all time highs (by the American indices). This is a negative divergence which is a warning sign as per historic signals.

SPX seem like have another 30% growth. Before it.. 5/June/24SPX500 chart seem like will have another potential gain of 30.5% +/- ( from 5075 +/- till 6600 +/-) up until US election

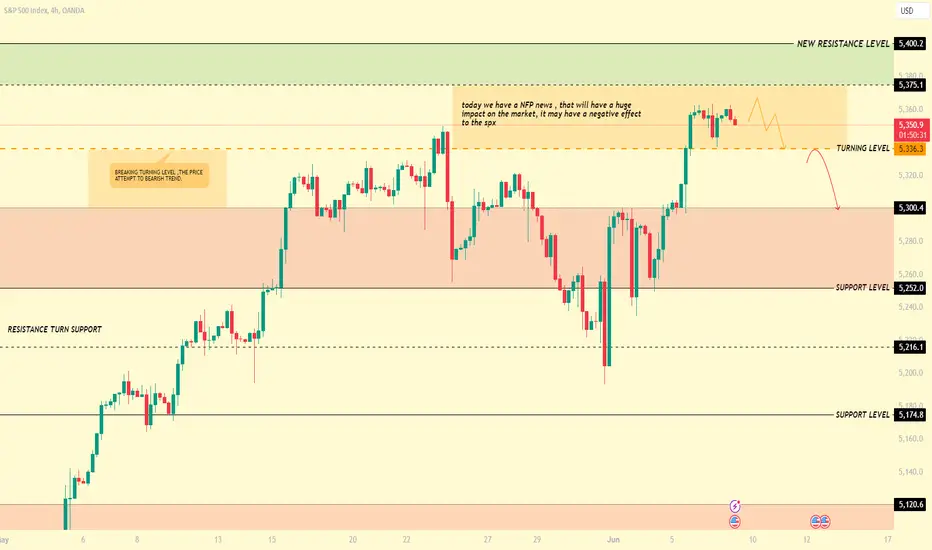
SPX500USD ( EFFECT NFP )SPX500USD
Tendency the price effect downward pressure
Turning level : The turning 5,336, so as long as the price trending above this level, there will be a bullish trend , but breaking this level the price it comes down ward pressure
resistance level : trade above 5,336 , the price will up to 5,375, then trending in this level touch a 5,400
support level : braking a turning level 5,336 ,the price will reach the support level of
5,300 and 5,252
* today we have a NFP , news I urge the trader to trading very carefully
Where is the SPX most likely headed in the coming yearsAlthough it's hard to predict what the stock market will do in the future, there is already a clear consensus on what is likely to happen.
In this chart, I have plotted most predictions from big investment banks like Goldman Sachs and Morgan Stanley to other investors like Michael Burry. I have also calculated the average of all the predictions and plotted it on the chart.
I think the most likely scenario is that we retest the lows of the Corona Virus Crisis, and then we trade sideways from there (illustrated with the red arrows). There is also the probability that we bounce off the 3000 SPX as the consensus estimates and then trade sideways from there (illustrated with blue arrows).
The main reason we might trade sideways for the coming years is because of a dilemma the Federal Reserve is currently facing. Having to fight a battle between high inflation caused by quantitative easing done during the Coronavirus Crisis, and fighting said inflation by raising interest rates which will make it harder to maintain its 30 Trillion dollars of debt obligations. Likely changing back and forth till there is a deleveraging of the whole system that will last at least 3 years. And since the markets are strongly correlated to what the fed does, this will be the most likely outcome.
Let me know your predictions and see if you agree more with the blue arrows or red arrows.

PARALLEL CHANNEL IDEA $SPXThere are about 3 parallel channels we can find on this chart from log, to auto and even a much larger channel from decades past that all line up to today.
I am using this channel as my first line of Resistance.
Rejecting this channel on the multi year time frame.
Bearish divergence on the weekly / monthly TF.
RSI & MACD have rejected the MA after a retest on the Weekly TF.
Invalidation here is very easy.. You break above this channel and confirm.. You have .4 to .5 % if you are to reach that trend line from here. However, you have quite a few reasons that we could stop and top out here and reject ......
I will post another channel I have later.

SPX500 Local Short!SPX500 went up to
Retest the horizontal
Resistance level of 5323.37
From where we will be
Expecting a local
Move down !

Bearish Divergence On The S&P 500Hey! I see bearish divergence on the S&P 500.
Expecting a pullback here.
This will make crypto drop.
Stay safe everyone.
- Dalin

Bulls and Bears zone for 06-06-2024S&P has been moving upwards this week and made a New ATH yesterday. Any test of yesterday's Close could provide some direction for today.
Level to watch: 5364 --- 5362

Hellena | SPX500 (4H): Short to 38.2% Fibo lvl 5205.Dear colleagues, I think that the price has either already completed or is about to complete the impulsive movement in wave “1”, so I expect the beginning of correction at least to the area of 38.2% Fibonacci level 5205. It is quite possible that the price will update the high and reach the area of 5375 before starting the correction.
Manage your capital correctly and competently! Only enter trades based on reliable patterns!

S&P 500 BearishUS Stock market is taking a break from the bullish aggressive push and soon it will be reflected in $S&P500 index.
Immediate area of demand as shown in the chart above
*********************************
Do your own research. Use a stop loss

SPX500Pair : SPX500 Index
Description :
Break of Structure and Retracement
RSI - Divergence
Falling Wedge as an Corrective Pattern in Short Time Frame
Consolidation Phase
Completed " 12345 " Impulsive Waves

SPX500 H4 | Potential resistance at 78.6% Fibonacci retracementThe SPX500 is rising towards a pullback resistance and could potentially reverse off this level to drop lower.
Sell entry is at 5,324.57 which is a pullback resistance that aligns with the 78.6% Fibonacci retracement level.
Stop loss is at 5,395.04 which is a level that aligns with the 127.2% Fibonacci extension level and sits above the all-time high.
Take profit is at 5,205.39 which is an overlap support that aligns close to the 38.2% Fibonacci retracement level.
High Risk Investment Warning
Trading Forex/CFDs on margin carries a high level of risk and may not be suitable for all investors. Leverage can work against you.
Stratos Markets Limited (www.fxcm.com):
CFDs are complex instruments and come with a high risk of losing money rapidly due to leverage. 68% of retail investor accounts lose money when trading CFDs with this provider. You should consider whether you understand how CFDs work and whether you can afford to take the high risk of losing your money.
Stratos Europe Ltd, previously FXCM EU Ltd (www.fxcm.com):
CFDs are complex instruments and come with a high risk of losing money rapidly due to leverage. 70% of retail investor accounts lose money when trading CFDs with this provider. You should consider whether you understand how CFDs work and whether you can afford to take the high risk of losing your money.
Stratos Trading Pty. Limited (www.fxcm.com):
Trading FX/CFDs carries significant risks. FXCM AU (AFSL 309763), please read the Financial Services Guide, Product Disclosure Statement, Target Market Determination and Terms of Business at www.fxcm.com
Stratos Global LLC (www.fxcm.com):
Losses can exceed deposits.
Please be advised that the information presented on TradingView is provided to FXCM (‘Company’, ‘we’) by a third-party provider (‘TFA Global Pte Ltd’). Please be reminded that you are solely responsible for the trading decisions on your account. There is a very high degree of risk involved in trading. Any information and/or content is intended entirely for research, educational and informational purposes only and does not constitute investment or consultation advice or investment strategy. The information is not tailored to the investment needs of any specific person and therefore does not involve a consideration of any of the investment objectives, financial situation or needs of any viewer that may receive it. Kindly also note that past performance is not a reliable indicator of future results. Actual results may differ materially from those anticipated in forward-looking or past performance statements. We assume no liability as to the accuracy or completeness of any of the information and/or content provided herein and the Company cannot be held responsible for any omission, mistake nor for any loss or damage including without limitation to any loss of profit which may arise from reliance on any information supplied by TFA Global Pte Ltd.
The speaker(s) is neither an employee, agent nor representative of FXCM and is therefore acting independently. The opinions given are their own, constitute general market commentary, and do not constitute the opinion or advice of FXCM or any form of personal or investment advice. FXCM neither endorses nor guarantees offerings of third-party speakers, nor is FXCM responsible for the content, veracity or opinions of third-party speakers, presenters or participants.

S&P 500 Index: Latest Analysts’ ForecastsS&P 500 Index: Latest Analysts’ Forecasts
Over the three spring months, the S&P 500 (US SPX 500 mini on FXOpen) rose by 3.5% – not the worst result, but it might be disappointing considering that in the first two months of the year the index increased by 7.8%.
This trend suggests that:
→ the rally driven by interest in AI is slowing down;
→ stock market participants are concerned that Fed rates will remain high.
What could be the scenarios for future developments until the end of the year and beyond?
The media publish fresh forecasts on the S&P 500 (US SPX 500 mini on FXOpen) price from Wall Street analysts:
→ MarketWatch: Analysts at JP Morgan believe that the growth potential is exhausted and the market may “hit a wall” preventing further growth. They maintain a forecast that the index value at the end of 2024 will be 4200 points.
→ MarketWatch: Experts at Wells Fargo think it would be too optimistic to expect stocks to reach new record highs ahead of the US elections in November; however, further growth related to the election results looks likely in 2025. They estimate the index could reach a record 5700 points by the end of next year.
→ BusinessInsider: According to Capital Economics, the index could rise if Treasury yields fall and the momentum from AI adoption remains strong. Their forecast is 6500 points by the end of 2025, followed by a sharp correction in 2026.
Technical analysis of the daily chart of the S&P 500 (US SPX 500 mini on FXOpen) today shows that:
→ the market is in an uptrend (marked by a blue channel);
→ the price has moved from the upper half to the lower half of the channel – a sign of weakening bullish strength;
→ the 5300 level acts as resistance;
→ the broad bullish candle on 31 May (marked by an arrow) closing near its highs indicates strong demand at the lower boundary of the channel, but whether it will be sufficient to overcome the 5300 level and consolidate above it will largely depend on the upcoming Fed rate decision (scheduled for 12 June).
Trade global index CFDs with zero commission and tight spreads. Open your FXOpen account now or learn more about trading index CFDs with FXOpen.
This article represents the opinion of the Companies operating under the FXOpen brand only. It is not to be construed as an offer, solicitation, or recommendation with respect to products and services provided by the Companies operating under the FXOpen brand, nor is it to be considered financial advice.

USSPX ( BULLISH TREND PRESSURE )USSPX
Tendency the price is a long in 5,336
Turning level : The turning 5,336, so as long as the price trending above this level, there will be a bullish trend
resistance level : trade above 5,336 , the price will up to 5,375, then trending in this level touch a 5,400
support level : braking a turning level 5,336 ,the price will reach the support level of
5,300 and 5,252
corrective level : price will attempt 5,336 , correct itself before long , then create a new historical price

US500 NEXT BEARISH MOVEMENT!Hello Traders and everyone, I am Hadi Karaali, Known as SNIPERS_FX
If you like the idea, do not forget to support with a like and follow.
US500 NEXT BEARISH MOVEMENT! 📚
👉As we can see price was clearly overall bullish making clean higher highs and higher lows.
Moreover, and recently price managed to break below or major swing low, for the bears to be taking over, However, price is in a clean correction movement approaching our massive 0.786 Fibonacci zone.
👉And as per my trading plan, I will be zooming into lower time frame to be looking for any bearish reversal pattern, to confirm the next bearish movement. 📚
If you like this kind of analysis don't forget to like and follow
and as usual follow your trading plan and manage your risk.
Be patient and good luck!

$SPY $SPX $QQQ Analysis, Key Levels & Targets for DAY Traders AMEX:SPY SP:SPX NASDAQ:QQQ Analysis, Key Levels & Targets for DAY Traders
Today’s Trading range is pretty wide — or widER than I would expect with the VIX crush we got on Friday!! 47 dollars in each direction and we closed on Friday just underneath the 30min 200MA after a WILD bounce off of the 1hr 200MA (labelled)
ATH’s are in today’s trading range.
Personally, I will be looking for shorting opportunities here but what are you guys looking at?
A full walkthrough of today’s trading range (and all daily ranges) on last night’s video!!
GL today, y’all!!
