SPX500 Bearish Breakout!
HI,Traders !
#SPX500 made a bearish
Breakout of the rising support
Line and we are bearish biased
Therefore, after retesting the sell cluster area
at 6643.11 So we will be expecting a Further
bearish move down !
Comment and subscribe to help us grow !
Trade ideas

SPX is absolute in the garbage now! Great inverse playI've been saying this for a few weeks now and all those who bought at the top are now official bag holders. There's a lot more bleeding that will happen. First, SMA9 crossed (check), next we'll see aggressive drop crossing SMA50, maybe some consolidation, and if it drops below SMA200, we're in for some interesting times. Don't stress, here's your play.....check out CBOE:UVIX , CBOE:MSTZ for inverse plays. There's still some nice upside. When they say, don't sell, you sell otherwise you'll be exit liquidity! I've seen this way too many times. Best of luck!
Pull back tease, but still bearing SPX!There's a bit of a pull back taking place, but I'm not buying it! There's a lot of f&ckery taking place and no lipstick will make this pig look pretty. Fundamentals are weak and volatility is spiking, long overdue! Nice inverse plays CBOE:UVIX CBOE:MSTZ

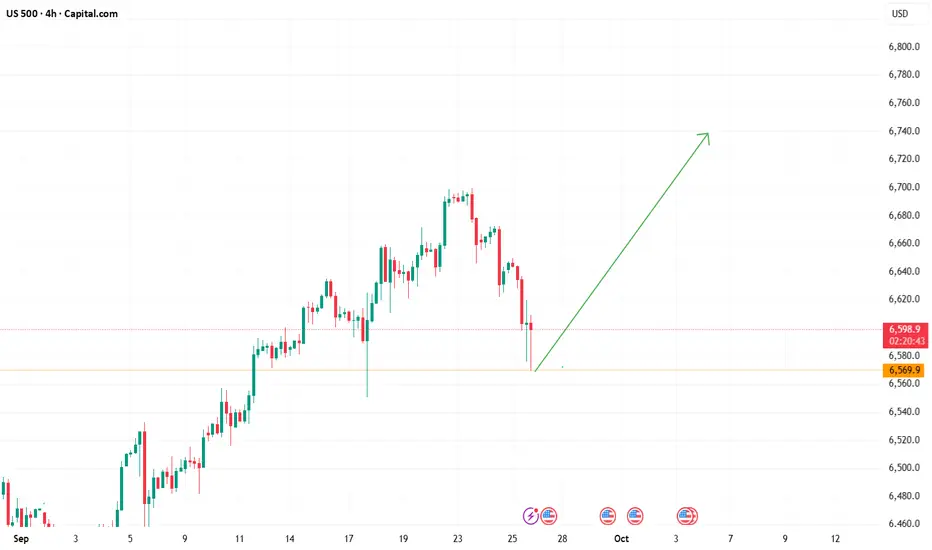
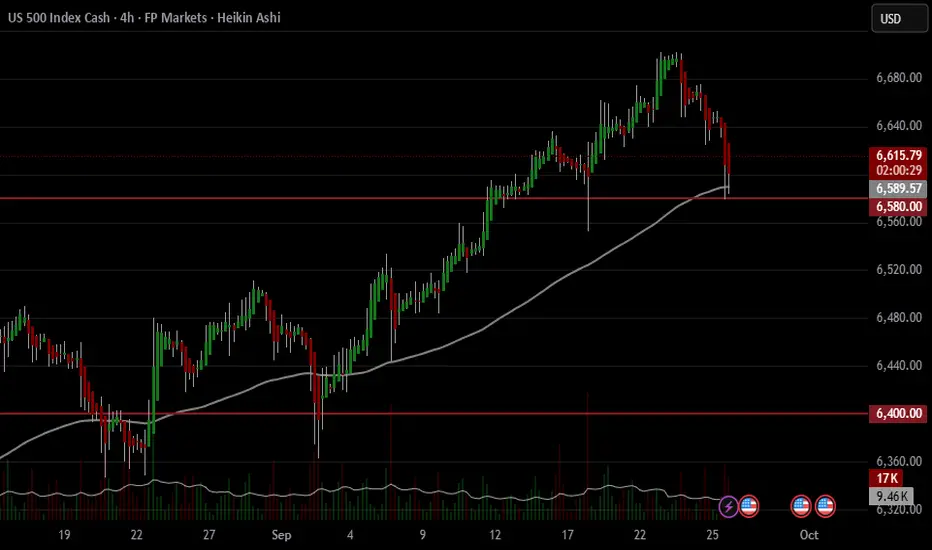
US500 Rally end?The S&P 500 is at a key moment right now, testing the 6580 support area after a sharp pullback from recent highs.
In my view, if this level breaks decisively with strong selling pressure, the market could head toward the 6400 zone, which has acted as an important support area in the past.
As long as 6580 holds, a bounce is still possible, but for now the risk seems tilted to the downside if we see a clear breakdown.
NOT FINANCIAL ADVICE.
Comment below with the ticker you’d like me to analyze next!
And don’t forget to leave a boost if you’d like to see more trading ideas like this :)
SPX frothy watersWe are currently operating firmly within the 4–5 range of several market cycles — a pattern that appears to be repeating consistently. Under such conditions, a prudent strategy is to remain mostly inactive, engaging only in limited, low-risk trades. Favor small positions, selling into strength and buying into weakness — in essence, "sell high, buy low."
Attempting to chase uptrends or buy into rallies while selling during minor corrections is likely to result in premature stop-outs, effectively eroding the gains accumulated thus far. The risk of giving back profits is elevated in this phase of the cycle.
A more significant pullback or structural correction is not expected until sometime after the first quarter of next year. Until then, restraint and precision are paramount.

S&P500 corrective pullback Recent moves: The S&P 500 (-0.36%) extended losses, still weighed by the AI-driven selloff earlier in the week. Futures have recovered about half of yesterday’s drop, but overall momentum looks paused.
Macro drivers:
US housing data + firmer oil prices dampened expectations for rapid Fed rate cuts.
This pushed Treasury yields higher, with a fresh steepening of the curve. 10yr yields are back near pre-payrolls levels (+10–15bps since the FOMC).
Today’s jobless claims are key after last week’s sharp drop, with tomorrow’s core PCE the bigger risk event.
Politics:
US government shutdown risks escalated, with the White House ordering contingency firings if funding lapses. Market anxiety may rise as deadlines loom.
Geopolitics in focus: Erdogan’s White House visit could bring defense deals (Boeing, Lockheed Martin) and NATO tensions remain over Russia.
Implication for S&P 500 trading:
Near-term tone is cautious, with yields back up and Fed easing hopes questioned.
Watch jobless claims for confirmation of labor resilience and core PCE tomorrow as the next major directional driver.
Shutdown risks add headline volatility, while defense sector stocks could outperform if US–Turkey talks deliver aircraft orders.
Key Support and Resistance Levels
Resistance Level 1: 6670
Resistance Level 2: 6700
Resistance Level 3: 6747
Support Level 1: 6550
Support Level 2: 6530
Support Level 3: 6500
This communication is for informational purposes only and should not be viewed as any form of recommendation as to a particular course of action or as investment advice. It is not intended as an offer or solicitation for the purchase or sale of any financial instrument or as an official confirmation of any transaction. Opinions, estimates and assumptions expressed herein are made as of the date of this communication and are subject to change without notice. This communication has been prepared based upon information, including market prices, data and other information, believed to be reliable; however, Trade Nation does not warrant its completeness or accuracy. All market prices and market data contained in or attached to this communication are indicative and subject to change without notice.


Still going up for SPX500USDHi traders,
I show you week after week what price will do. If you follow my outlooks, you've made a lot of profit.
For example SPX500USD played out exactly as predicted in my previous outlook. After a sharp correction it continued the upmove and made a new ATH.
Now next week we could see a little more upside and a bigger correction down for (orange) wave 4.
Let's see what the market does and react.
Trade idea: Wait for a small pullback and a change in orderflow to bullish on a lower timeframe to trade longs.
If you want to learn more about trading FVG's & liquidity sweeps with Elliott wavecount and patterns, then please make sure to follow me.
This shared post is only my point of view on what could be the next move in this pair based on my technical analysis.
Don't be emotional, just trade your plan!
Eduwave

Hellena | SPX500 (4H): SHORT to support area of 6550.Colleagues, I am not much of a correction trader, but I have to share my opinion that the upward impulse has almost formed wave “5” and now it would still be logical to expect a correction.
I believe that first the price will update the local maximum in the resistance area of 6759, then we will see a correction in wave “4”, which I expect to see at least in the support area of 6550.
Manage your capital correctly and competently! Only enter trades based on reliable patterns!

S&P 500: Pullback after flash dump is a Short opportunity
📝 1. Market Context
BLUEBERRY:SP500 recently witnessed a sharp drop from 6,698 down to 6,645, showing clear bearish momentum. After this fall, the index attempted a recovery, but the bounce was weak: green candles became smaller and stalled right at key resistance zones. A long red bearish engulfing candle then erased the entire recovery, proving sellers are back in control.
🟥 2. Static Resistance (Red Zone on Chart)
On the chart, the red zone represents static resistance, located around 6,671 – 6,664.62. This area aligns with:
• Dynamic resistance (moving averages).
• Static resistance (previous supply zone).
Every time price has tested this area, it faced rejection. This makes the red zone a high-probability level for sellers to step in again if price retests it.
🟩 3. Support Zone (Green Zone on Chart)
The nearest support lies at 6,639, highlighted as the green zone on the chart. This is the first logical downside target, where price might pause or react before choosing the next move.
🎯 4. Bearish Scenario
• Bias: Bearish continuation.
• Entry zone: 6,671 – 6,664.62 (red resistance zone).
• Target: 6,639 (blue support zone).
• Invalidation: If price closes firmly above 6,672, this bearish idea is no longer valid.
✅ 5. Summary
After a sharp decline, the weak bounce into resistance looks like an opportunity for sellers. As long as the index remains below the red resistance zone, the path of least resistance points lower, with 6,639 as the next key support to watch.
📈 Similar to the previous Buy setup, we can see that price is reacting in a similar manner — it touches the static support zone (marked in green) and the moving average (acting as dynamic resistance), before making a strong bounce.
Please like and comment below to support our traders. Your reactions will motivate us to do more analysis in the future 🙏✨

S&P500: Flash dump continues, short bias remains!
📝 1. Market Context
BLUEBERRY:SP500 Yesterday’s analysis highlighted the weakness after the market failed at resistance. Today, that scenario was confirmed with a flash dump and a sequence of strong red candles, signaling sellers remain firmly in control. The short-term structure continues to print lower highs and lower lows, which clearly reflects the dominance of the bearish trend.
🟥 2. Resistance Zone
The 6,651 – 6,658 area (red zone on the chart) continues to act as a critical resistance. This zone is reinforced by 4 levels of resistance combined with moving averages (MA). Moreover, the latest bounce is still contained within a large red candle, signaling that buyers lack the strength to shift momentum.
Each time price tested this zone, it faced strong rejection. As long as the market trades below this red zone, the dominant trend remains bearish.
📉 3. Bearish Trend & Downside Targets
Currently, the market has confirmed the bearish trend by consistently forming lower highs. This is already the third bearish leg since the downtrend began – and according to wave logic, the third leg often turns out to be the strongest one, provided resistance at 6,658 holds.
• Immediate target: 6,629 – 6,615 (a key support cluster that previously rejected price).
• If broken: selling pressure could push the market further down toward 6,578 and even 6,560 – both strong technical and psychological support levels.
✅ 4. Conclusion
The S&P500 has confirmed its bearish trend with a flash dump. The 6,651 – 6,658 area remains the critical resistance, and as long as price stays below this zone, sellers have the upper hand. The bearish scenario remains valid with the first target at 6,629 – 6,615, and if this support fails, the move could extend toward 6,578 – 6,560.
Please like and comment below to support our traders. Your reactions will motivate us to do more analysis in the future 🙏✨

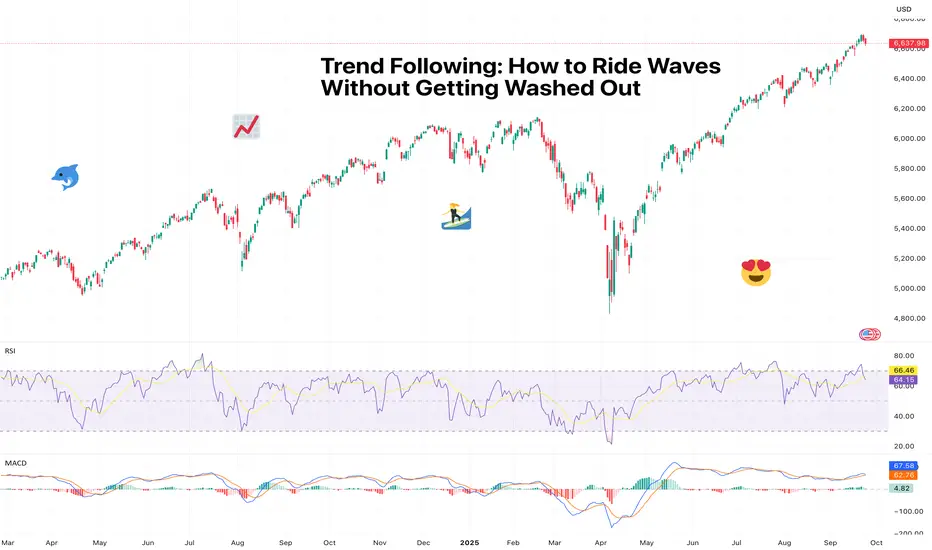
Trend Following: How to Ride Waves Without Getting Washed OutMarkets move in waves. Easy, right? But if you’ve tried catching one only to find out you get washed out, you’ve realized it ain’t’ that easy.
Sometimes there are gentle ripples that lull traders into boredom, other times they’re tsunamis that wipe out everything in sight.
The trick isn’t predicting when the next big set will hit – it’s learning how to catch it without falling off your board from the get-go. That’s where trend following comes in. Simple, structured, and surprisingly effective, it’s a strategy that says: stop guessing, start riding.
🌊 Catching It, Not Fighting It
At its core, trend following is about spotting momentum and sticking with it. If prices are climbing, you’re a buyer. If they’re falling, you’re a seller. No need to argue with the market about “fair value.” The trend follower’s mantra is: Mr. Market is always right, I’m just here to hitch a ride.
Why does this work? Because markets are essentially a bunch of thinking participants who move in herds. They share the same fears, hopes, expectations, and goals.
Traders, funds, and algorithms pile into the same ideas, technical patterns, and price levels, pushing valuations higher or lower. Your job isn’t to outsmart the herd – it’s to ride with it until the stampede loses steam.
Or better yet, spot the opportunity before the herd. "I am the animal at the head of the pack. I either get eaten, or I get the good grass,” says David Tepper, hedge fund manager.
🤫 Why It’s Harder Than It Sounds
“Buy high, sell higher” feels wrong anywhere but in the market. Human brains are usually wired to hunt for bargains, not chase expensive things. But there’s something about a record high that pulls you in and makes you say “Take my money!”
Traders love to bet on success. So when they see that Bitcoin BITSTAMP:BTCUSD is at $117,000 , near a record, it’s easier to throw cash than when it’s crashing and burning at a 60% discount.
True, no trend stays intact after a huge drop. But sometimes it’s better to see confirmation that the trend is exhausted than to exit during a mild dip and risk missing out on the big move.
Trend following isn’t about catching every top or bottom. It’s about accepting that you’ll never time it perfectly, but if you stay disciplined and let the trend play out, you’ll capture at least some of the move.
But in trading everything’s possible – some prefer to catch tops and bottoms, and that’s completely fine as long as it works.
“For twelve years I have been missing the meat in the middle but I have made a lot of money at tops and bottoms,” says Paul Tudor Jones, another big name in the industry.
📈 Tools of the Trade
So how do you know a trend is worth following? Traders lean on a few classics:
• Moving averages : If the 50-day is above the 200-day, that’s your green light. Prices above both? Bullish trend intact. Prices dive below the 200-day? Cue that a bear market is here.
• Support and resistance : Connect the dots (literally) and see if the price is respecting an upward or downward slope.
• Breakouts : When the price pops above resistance or drops below support on big volume, that’s the market saying, “Watch this.”
• Reversals : For those that like to live on the edge, spotting reversals might be a good way to catch a move from start to finish.
The trick isn’t in the tool itself, but in sticking to the plan when the inevitable wiggles and pullbacks happen.
🚤 Don’t Mistake Chop for Trend
Not every chart with bars pointing up is a trend. Sometimes you’re just looking at chop – those sideways, back-and-forth price moves that exist to chew up stop-losses and ruin Fridays.
Trend followers learn to wait for confirmation. That could mean a clean breakout with volume, or a moving average crossover with conviction. Enter too early, and you may find yourself drowning in false signals.
A confirmation is oftentimes triggered by economic news and reports. So pay attention to big and small releases stacked in the Economic Calendar .
🛟 The Stop-Loss Lifeboat
Here’s a little secret of trend following: you’ll be wrong a lot. The method is built around small losses and (occasional) big wins. That’s why stop-losses are essential . You’re not trying to win every trade, you’re trying to catch the few monster trends that more than pay for the slip-ups.
Think of it like surfing: you’ll get wiped out plenty of times, but you only need one clean wave to make the day worthwhile.
📊 The Math Behind the Swings
Why does this work over time? Because of asymmetric returns. If you risk $1 to make $3, you only need to be right 30% of the time to profit. Trend followers build systems where the losers are cut quickly, but the winners are allowed to run. That’s where the proper risk-reward ratio comes in.
Most traders do the opposite. They cut winners too early (“I’ll take my quick profit!”) and let losers drag on (“It’ll bounce, right?”).
🧩 Famous Trend Followers
This isn’t just theory. The Turtle Traders in the 1980s—an experiment by Richard Dennis and William Eckhardt—proved that complete novices could learn a rules-based trend following system and make millions. Fast forward, and big CTAs (Commodity Trading Advisors) still run billions using similar strategies today.
They all share one principle: don’t predict, only follow.
⏳ Patience Pays
The hardest part isn’t identifying trends. It’s sticking with them. Every pullback will tempt you to bail. Every analyst estimate, every scary headline, even your cousin at Thanksgiving telling you “Ether’s going to zero” will test your patience.
But trends don’t end because you got nervous. They end when the move breaks. Patience is what separates the trend followers who catch the big wave from the ones stuck paddling.
🎯 Final Take: Ride It Out
Trend following may not make you look like Paul Tudor Jones calling tops and bottoms. But it will keep you aligned with where the money is flowing. And when you’re on the right side of a trend, the ride is smoother, the wins are bigger, and the stress is lower.
Off to you : When’s the last time you got a nice wave and surfed it out to completion? Share your experience in the comments!
S&P pullback to 5900$Short post:
The market pullback to 5900$ is on the charts and probably accelerates in October mid week...

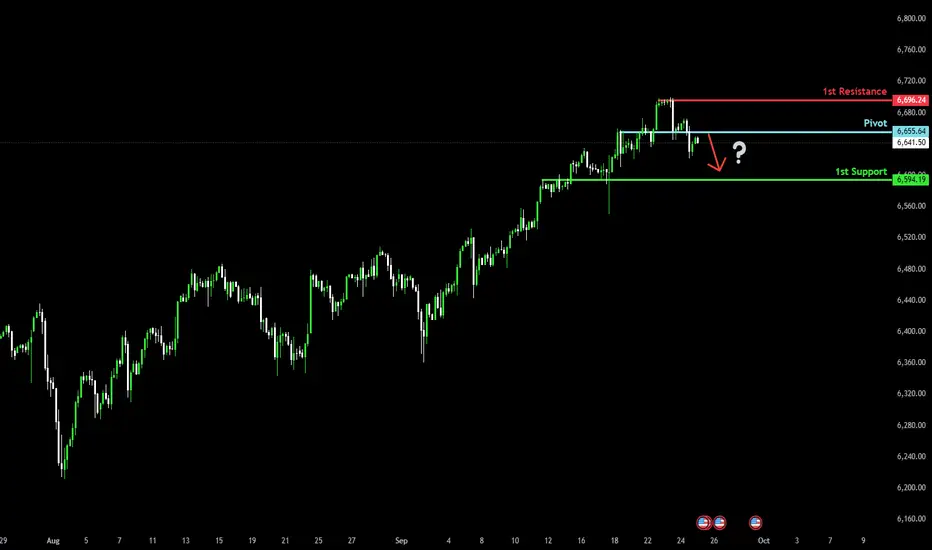
Could we see a bearish reversal?S&P500 (US500) is rising towards the pivot which acts as an overlap resistance and could reverse to the 1st support.
Pivot: 5,544.64
1st Support: 6,594.19
1st Resistance: 6,696.24
Disclaimer:
The above opinions given constitute general market commentary, and do not constitute the opinion or advice of IC Markets or any form of personal or investment advice.
Any opinions, news, research, analyses, prices, other information, or links to third-party sites contained on this website are provided on an "as-is" basis, are intended only to be informative, is not an advice nor a recommendation, nor research, or a record of our trading prices, or an offer of, or solicitation for a transaction in any financial instrument and thus should not be treated as such. The information provided does not involve any specific investment objectives, financial situation and needs of any specific person who may receive it. Please be aware, that past performance is not a reliable indicator of future performance and/or results. Past Performance or Forward-looking scenarios based upon the reasonable beliefs of the third-party provider are not a guarantee of future performance. Actual results may differ materially from those anticipated in forward-looking or past performance statements. IC Markets makes no representation or warranty and assumes no liability as to the accuracy or completeness of the information provided, nor any loss arising from any investment based on a recommendation, forecast or any information supplied by any third-party.
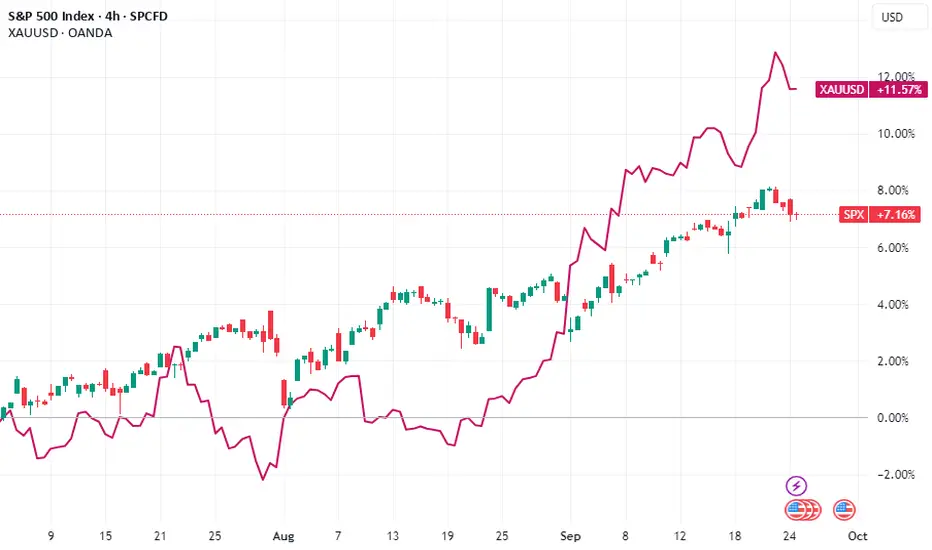
Gold’s Decade Shines Less Brightly for Stocks: The New Rational
Gold’s Decade Shines Less Brightly for Stocks: The New Rationale for the King Metal
For over a decade, the narrative surrounding gold was one of stark contrast to the equity markets. As stock indices, powered by tech innovation and ultra-low interest rates, embarked on a historic bull run, gold was often relegated to the sidelines—a relic for the fearful, an underperforming asset in a world chasing yield. The 2010s were, without question, the decade of the stock market. Gold’s shine, by comparison, seemed dull.
But a perceptible shift is underway. The latest rally in gold, which has seen it scale unprecedented nominal heights, is not the frantic, fear-driven surge of past crises. Instead, it appears to be driven by a more sober, strategic, and perhaps more durable force: the rational calculations of central banks and a fundamental rewiring of the global financial architecture. This new rationale suggests that gold’s resurgence may not spell immediate doom for stocks, as traditional wisdom would hold, but rather reflects a new, more complex macroeconomic reality where the two can coexist, albeit with gold casting a long, less brilliant shadow over the equity landscape.
The Ghost of Gold Rallies Past: A Tale of Fear and Froth
To understand the significance of the current rally, one must first revisit the drivers of previous gold booms. Historically, gold’s major upward moves were tightly correlated with periods of acute stress and negative real interest rates.
The post-2008 financial crisis surge, which took gold from around $800 an ounce in 2008 to over $1,900 in 2011, was a classic "fear trade." The world was confronting a systemic banking collapse, unprecedented monetary experimentation in the form of Quantitative Easing (QE), and rampant fears of runaway inflation and currency debasement. Gold was the safe haven, the hedge against a collapsing system. Similarly, the spike in mid-2020, at the onset of the COVID-19 pandemic, was a panic-driven flight to safety as global economies screeched to a halt.
These rallies shared common characteristics: they were often sharp, volatile, and ultimately prone to significant retracements. When the immediate crisis abated—when inflation failed to materialize post-2008, or when fiscal and monetary stimulus ignited a V-shaped stock market recovery in 2020—the rationale for holding a non-yielding asset weakened. Money flowed back into risk assets like stocks. Gold’s role was binary: it was the asset for when things were falling apart. In a functioning, risk-on market, it had little place.
This created the perception of an inverse relationship. A strong gold price was a signal of market distress, and thus, bad for stocks. But this decade is different.
The New Architects: Central Banks and Strategic Repatriation
The most profound change in the gold market has been the transformation of its largest and most influential buyers: central banks. For years, the narrative was that developed Western central banks, holders of the world’s primary reserve currencies, were gradually diversifying away from gold. The modern financial system, built on the U.S. dollar, Treasury bonds, and other interest-bearing instruments, was deemed superior.
That assumption has been decisively overturned. Since around 2010, but accelerating dramatically in recent years, central banks—particularly those in emerging economies—have become net purchasers of gold on a massive and sustained scale. The World Gold Council reports that central banks have been adding to their reserves for over a decade, with annual purchases hitting multi-decade records.
This buying is not driven by panic. It is a calculated, long-term strategic move rooted in three key rationales:
1. De-dollarization and Geopolitical Hedging: The weaponization of the U.S. dollar through sanctions, particularly against Russia following its invasion of Ukraine, served as a wake-up call for nations not squarely in the U.S. geopolitical orbit. Holding vast reserves in U.S. Treasury bonds suddenly carried a new risk: they could be frozen or seized. Gold, by contrast, is a sovereign asset. It can be held within a nation’s own vaults, is nobody’s liability, and is beyond the reach of any other country’s financial system. For China, Russia, India, Turkey, and many nations in the Global South, accumulating gold is a strategic imperative to reduce dependency on the dollar and insulate their economies from geopolitical friction.
2. Diversification Against Fiscal Profligacy: Even for allies of the U.S., the sheer scale of U.S. government debt is a growing concern. With debt-to-GDP ratios at record levels in many developed nations and little political will to address them, the long-term value of fiat currencies is being questioned. Central banks are increasingly viewing gold as a perennial hedge against the fiscal and monetary policies of their allies—a form of insurance against the potential devaluation of the very government bonds that form the backbone of their reserves.
3. A Return to a Multi-Polar Financial World: The post-Bretton Woods era has been dominated by the U.S. dollar. There are increasing signs that the world is shifting towards a multi-polar system, with the euro, Chinese yuan, and possibly other currencies playing larger roles. In such a transitional period, gold’s historical role as a neutral, trusted store of value becomes immensely attractive. It is the one asset that is not tied to the economic fortunes or policies of a single nation.
This central bank demand provides a powerful, structural floor under the gold price. It is consistent, price-insensitive buying (they are not chasing momentum but executing a strategy) that is largely divorced from the short-term sentiment swings of the stock market. This is the "more rational calculation" that makes the current rally fundamentally different and potentially longer-lasting.
The Interest Rate Conundrum: Gold’s Old Nemesis Loses Its Bite
For years, the primary argument against gold was simple: it offers no yield. In a world of rising interest rates, where investors can earn a attractive, risk-free return on cash or government bonds, the opportunity cost of holding gold becomes prohibitive. The theory held that the Federal Reserve’s aggressive hiking cycle from 2022 onward would crush the gold price.
It didn’t. Gold not only weathered the storm but continued its ascent. This paradox reveals another layer of the new rationale.
While nominal rates rose, real interest rates (nominal rates minus inflation) have been more ambiguous. Periods of high inflation meant that even with higher rates, the real return on cash and bonds was often negative or minimal. In such an environment, gold, as a traditional inflation hedge, retains its appeal.
More importantly, the market’s focus has shifted from the level of rates to their trajectory. There is a growing belief that the era of structurally higher interest rates is unsustainable, given the colossal levels of global debt. Servicing this debt becomes exponentially more difficult as rates rise. Therefore, many market participants are betting that the current rate cycle represents a peak, and that central banks will be forced to cut rates sooner rather than later, regardless of the inflation fight. Gold performs well in a environment of falling rates, and this anticipation is being priced in now.
Furthermore, high rates have begun to expose fragilities in the system, from regional banking crises in the U.S. to debt distress in emerging markets. In this sense, high rates haven't killed gold’s appeal; they have reinforced its role as a hedge against the consequences of high rates—namely, financial instability.
A Less Bright Shine for Stocks: Coexistence in a New Reality
So, what does this new, rationally-driven gold bull market mean for stocks? The relationship is no longer a simple inverse correlation. It is more nuanced, suggesting a future of coexistence rather than direct competition, but one where gold’s strength signals underlying headwinds that will dim the stellar returns equities enjoyed in the previous decade.
1. The End of the "Free Money" Era: The 2010s were built on a foundation of zero interest rates and quantitative easing. This environment was nirvana for growth stocks, particularly in the tech sector, as future earnings were discounted at very low rates, justifying sky-high valuations. The new macroeconomic order—one of higher structural inflation, larger government debt, and geopolitical fragmentation—is inherently less favorable to such valuation models. Gold’s strength is a symptom of this new order. It doesn’t mean stocks will collapse, but it does suggest that the era of effortless, broad-based double-digit annual returns is likely over. Returns will be harder won, more selective, and more volatile.
2. A Hedge Within a Portfolio, Not a Replacement: Investors are now likely to view gold not as a binary alternative to stocks, but as a critical component of a diversified portfolio. In a world of heightened geopolitical risk and uncertain monetary policy, holding a portion in gold provides stability. This means fund flows are not a simple zero-sum game between the SPDR Gold Trust (GLD) and the SPDR S&P 500 ETF (SPY). Institutions and individuals may increase allocations to both, using gold to mitigate the specific risks that now loom over the equity landscape.
3. Sectoral Winners and Losers: A strong gold price is a direct positive for gold mining stocks, a sector that has been largely neglected for years. This could lead to a resurgence in this niche part of the market. Conversely, the factors driving gold—higher inflation and rates—are headwinds for long-duration assets like high-flying tech stocks. The outperformance may shift towards value-oriented sectors, commodities, and industries with strong pricing power and tangible assets. The stock market’s shine may dim overall, but it will create bright spots in new areas.
4. The Signal of Sustained Uncertainty: Ultimately, a gold market driven by central bank de-dollarization and fiscal concerns is a barometer of persistent, low-grade global uncertainty. This is not the acute panic of 2008, but a chronic condition of fragmentation and distrust. Such an environment is not conducive to the explosive, confidence-driven growth that stock markets thrive on. It favors caution, resilience, and tangible value over speculative growth. Gold’s steady ascent is the clearest signal of this psychological shift.
Conclusion: A Duller but More Enduring Glow
The gold rally of the 2020s is not a siren call of an imminent market crash. It is the quiet, determined accumulation of a strategic asset by the world’s most powerful financial institutions. It is a vote of no confidence in the unfettered dominance of the current financial order and a bet on a more fragmented, uncertain future.
For stock market investors, this does not necessarily portend a bear market. Instead, it heralds a more challenging environment where the tailwinds of globalization and cheap money have reversed. The dazzling shine of the stock market’s previous decade is likely to be replaced by a duller, more realistic glow. Returns will be more modest, risks more pronounced, and the need for prudent diversification more critical than ever.
In this new era, gold and stocks will learn to coexist. The king of metals is no longer just a refuge for the fearful; it has become a strategic holding for the rational. Its decade may not shine with the same speculative brilliance as the stock market’s last bull run, but its light may well prove to be more enduring, illuminating a path through a landscape of greater complexity and risk. The lesson for investors is clear: the old rules are changing, and in this new game, gold holds a very strong hand.
US 500 in a "melt-up" phaseOutlook
US 500 is currently in a "melt-up" phase, trading near record highs, with a positive bias for the short to medium term. The primary drivers are strong earnings, recent Federal Reserve rate cuts, and continued investment in the technology and AI sectors. While the market is showing some signs of consolidation and potential volatility, the overall trend remains bullish. Analysts are forecasting the possibility of the index reaching 7,000 by year-end, contingent on continued favorable macroeconomic data and a sustained dovish stance from the Fed. However, a degree of caution is warranted due to stretched valuations and geopolitical uncertainties.
Fundamental Analysis
The bullish sentiment is underpinned by solid fundamental support. Corporate earnings momentum is strong, with analysts forecasting a 9.4% growth in US 500 year end profits. This growth has surprisingly outpaced potential headwinds from trade tensions and economic slowdown risks. The market rally has been driven by a resilient corporate sector that has successfully expanded profit margins, even amid various economic challenges.
The market's performance is not solely based on a multiple expansion i.e., higher valuations, but is significantly supported by actual profit growth, which accounts for a substantial portion of the index's year to date return. This suggests that the rally is not a "bubble" but rather a reflection of genuine corporate strength. Furthermore, the market rally is beginning to broaden beyond the "mega-cap" tech stocks, with small-cap and value stocks showing renewed strength, a trend often associated with expectations of lower interest rates and a more robust, widespread economic expansion.
Technical Analysis
From a technical perspective, the US 500 is in an intermediate uptrend. The index is currently testing a key resistance zone between 6,675 and 6,700 points. The ability to break and hold above this range is crucial for a continued move higher toward the 7,000 target.
Resistance: The immediate resistance is in the 6,675 –6,700 range.
Support: Support to watch is 6,610 and a stronger support at 6,555. Holding above these levels is essential to maintain the current bullish trend. A break below 6,555 could signal a deeper correction.
Momentum: RSI suggests that while a period of consolidation or a minor pullback is possible, a major sell-off is not yet indicated by this metric alone.
Outlook: As long as the index holds above the stated support pivots, the technical outlook remains positive.
Analysis by Terence Hove, Senior Financial Markets Strategists at Exness

S&P 500 Reaches Resistance in Both 1H and 1W TimeframesThe S&P 500 has made nearly a 40 percent run from the April dip despite rising stagflation risks. Traders have chosen to focus on earnings and AI optimism, and that is likely to continue.
However, the market has now reached a point where the upper lines of both the 1H and 1W trend channels are being tested, which should not be ignored. There is no reason to dismiss the strength of this magnificent bull market, but a bit of caution may be wise for those fully loaded with stocks or long the index via CFDs.
In the short term, there is a risk of a correction toward 6,500.


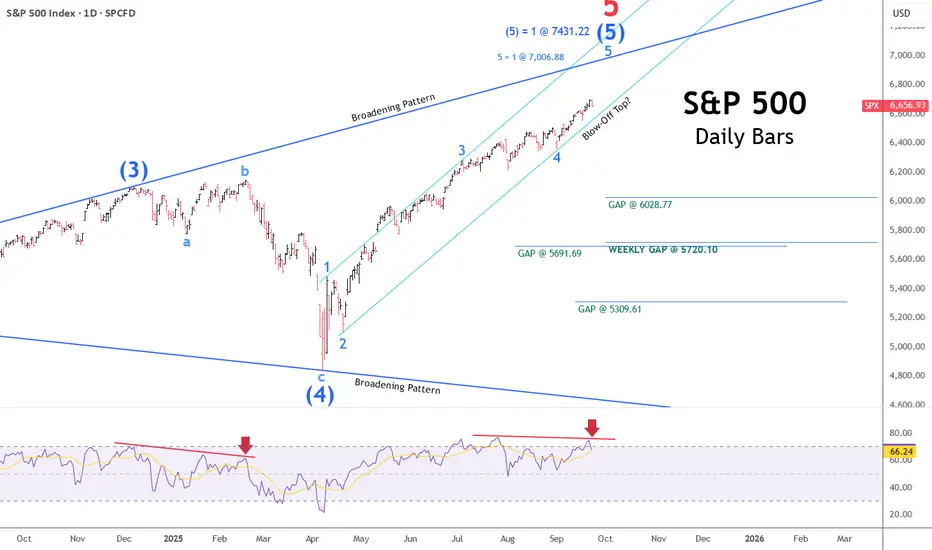
Will the Stock Market Ever Top?When it does, how long will that top last?
The question on the minds of many is just how high this blow-off top in the stock market will go. The cyclical bull market is running a bit long in the tooth and, by every conceivable measure, should be due for a healthy correction at the very least.
No, we’re not talking about the bull market run from the Tariff Tantrum lows in April; we’re talking about a 16-year run-up from the 2009 lows of the Great Financial Crisis—a low, in my view, that was never allowed to clear adequately.
The chart below illustrates the short-term, quintessential V-shaped recovery rebound from the April lows this past spring. These instant recoveries to fresh all-time highs have been a hallmark since the COVID bottom in 2020.
The daily chart above shows five clear waves of advance within a larger broadening pattern. Though a top can form at a moment’s notice from this point forward, the daily chart indicates two outstanding upside price targets at 7,006.88 and 7,431.22, respectively—each a Fibonacci extension of previous wave relationships.
Near-term downside targets ripe for the taking amid any meaningful pullback are represented by the four open gaps listed in the daily chart.
Next, we’ll zoom in a bit closer, looking at a 3-hour chart just before today’s close, with the S&P down slightly, just over half of one percent.
The shaded box above the price action illustrates an upside target window ranging from 6,704.45 on the low end to 7,006.88 on the high side, with an additional target of 6,710.67—also near the lower end of the range. The session’s high earlier was 6,699.52, less than 5 points from the threshold of our standing target window.
I’ll close out this stock market update with our long-term trading chart, which tracks the S&P’s weekly bars from the COVID low.
Above, you can see the broadening pattern mentioned earlier, along with another upside Fibonacci extension target noted at 7,431.22 and an important weekly gap at the 5,720.10 level.
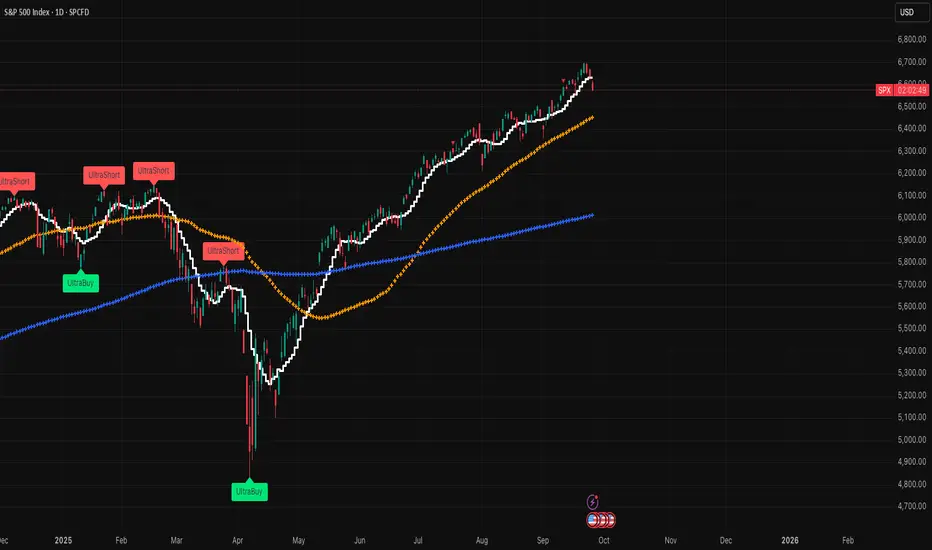
The long-term buy-and-sell indicators at the top and bottom of the chart are not designed to capture or pick tops and bottoms; rather, they aim to capture the lion’s share of a given long-term trend and help you avoid devastating crashes and extended bear markets.
The lower-panel histogram issues buy signals a bit earlier and sell signals a bit later, while the upper-panel crossover study tends to be more active, issuing sell signals earlier and buy signals later.
Regardless of where and when the market tops—if it ever does—at the rate we’re going, be mindful of the risks inherent in making assumptions and extrapolating past performance into future expectations. Why? Because amid the Fourth Turning, old rules may no longer apply, and market tops may last much longer than we have become accustomed to.
SPX500 ShortElite Strategy
Waiting price to come tap OB twice to confirm OB to TOB
Execute in smaller time frame
Targeting lower liquidity pools
Main target Structural liquidity

SPX .A fake above 6660A fake nove above 6660.Now back in support for a rethink.Lets see if suppport holds.?

Major Global Soft Commodity Markets1. Understanding Soft Commodities
1.1 Definition and Classification
Soft commodities are raw materials that are cultivated, harvested, and traded for various purposes, including food, feed, fuel, and fiber. Unlike hard commodities such as metals and energy resources, softs are perishable and subject to seasonal cycles. They are typically traded on futures markets, allowing producers to hedge against price fluctuations and investors to speculate on price movements.
1.2 Key Characteristics
Perishability: Most soft commodities have a limited shelf life, requiring efficient storage and transportation systems.
Seasonality: Production cycles are influenced by planting and harvesting seasons, affecting supply and prices.
Geographic Concentration: Certain regions dominate the production of specific soft commodities, making them vulnerable to local disruptions.
Price Volatility: Prices can be highly volatile due to factors like weather events, pests, and geopolitical tensions.
2. Major Soft Commodities and Their Markets
2.1 Coffee
Coffee is one of the world's most traded commodities, with Brazil, Vietnam, and Colombia being the top producers. The market is influenced by factors such as climate conditions, currency fluctuations, and global demand trends. Futures contracts for coffee are traded on exchanges like ICE Futures U.S., providing a benchmark for global prices.
2.2 Cocoa
Cocoa is primarily produced in West Africa, with Ivory Coast and Ghana leading global production. The market has experienced significant price fluctuations due to supply deficits, often caused by adverse weather conditions and political instability in producing countries. The New York Cocoa Exchange, now part of ICE Futures U.S., plays a crucial role in setting global cocoa prices.
2.3 Sugar
Sugar is a staple in the global food industry, with Brazil, India, and China being major producers. The market is influenced by factors such as government policies, biofuel mandates, and global consumption patterns. Futures contracts for sugar are traded on exchanges like ICE Futures U.S., providing transparency and liquidity to the market.
2.4 Cotton
Cotton is essential for the textile industry, with China, India, and the United States being the largest producers. The market is affected by factors like weather conditions, labor costs, and global demand for textiles. Futures contracts for cotton are traded on exchanges such as ICE Futures U.S., offering a platform for price discovery and risk management.
2.5 Corn and Soybeans
Corn and soybeans are vital for food, feed, and biofuel industries. The United States is a leading producer of both crops, with significant exports to countries like China and Mexico. Futures contracts for these commodities are traded on exchanges like the CME Group, providing mechanisms for hedging and speculation.
2.6 Wheat
Wheat is a staple food for billions worldwide, with major producers including Russia, the United States, and China. The market is influenced by factors such as weather conditions, global demand, and trade policies. Futures contracts for wheat are traded on exchanges like the CME Group, offering a platform for price discovery and risk management.
3. Trading and Investment in Soft Commodities
3.1 Futures Markets
Futures markets are central to the trading of soft commodities, allowing producers to hedge against price fluctuations and investors to speculate on price movements. Exchanges like ICE Futures U.S. and the CME Group provide platforms for trading futures contracts, offering transparency and liquidity to the market.
3.2 Exchange-Traded Funds (ETFs)
ETFs provide investors with exposure to soft commodities without the need to directly trade futures contracts. For example, the Teucrium Corn Fund (CORN) and the Teucrium Soybean Fund (SOYB) offer investors a way to invest in these commodities through the stock market.
3.3 Physical Trading
Physical trading involves the buying and selling of actual commodities, often through long-term contracts between producers and consumers. Companies like ECOM Agroindustrial play a significant role in the physical trading of commodities such as coffee, cocoa, and cotton.
4. Factors Influencing Soft Commodity Markets
4.1 Weather and Climate Conditions
Adverse weather events like droughts, floods, and hurricanes can significantly impact the production of soft commodities, leading to supply shortages and price volatility.
4.2 Geopolitical Events
Political instability, trade disputes, and sanctions can disrupt supply chains and affect the prices of soft commodities.
4.3 Economic Policies
Government policies, such as subsidies, tariffs, and biofuel mandates, can influence the production and consumption of soft commodities, impacting their market dynamics.
4.4 Global Demand Trends
Changes in consumer preferences, population growth, and dietary habits can affect the demand for soft commodities, influencing their prices.
5. Challenges and Risks in Soft Commodity Markets
5.1 Price Volatility
Soft commodity markets are characterized by high price volatility due to factors like weather conditions, geopolitical events, and market speculation.
5.2 Supply Chain Disruptions
Natural disasters, transportation issues, and political instability can disrupt supply chains, leading to shortages and price increases.
5.3 Regulatory Uncertainty
Changes in government policies, such as trade restrictions and environmental regulations, can create uncertainty in the market.
6. Outlook for Soft Commodity Markets
6.1 Emerging Markets
Countries in Asia and Africa are becoming increasingly important players in the production and consumption of soft commodities, influencing global market trends.
6.2 Technological Advancements
Innovations in agricultural technology, such as precision farming and biotechnology, have the potential to improve yields and reduce the environmental impact of soft commodity production.
6.3 Sustainability Initiatives
There is a growing emphasis on sustainable practices in the production and trade of soft commodities, driven by consumer demand and regulatory pressures.
7. Conclusion
Soft commodities are integral to the global economy, influencing food security, industrial production, and trade dynamics. Their markets are complex and influenced by a myriad of factors, including weather conditions, geopolitical events, and economic policies. Understanding these markets is crucial for producers, traders, and investors alike to navigate the challenges and opportunities they present.