S&P 500 (US500) MASSIVE TECHNICAL BREAKDOWN | ULTIMATE Trading 🚀 S&P; 500 (US500) MASSIVE TECHNICAL BREAKDOWN | Oct 27-31, 2025 | ULTIMATE Trading Strategy 📊
Current Price: 6,792.5 | Strategy: Intraday Swing Trading | Timeframes: 5M → 1D Analysis ⏰
━━━━━━━━━━━━━━━━━━━━━━━━━━━━━━━━━━━━━━━━━━━━━━━━━━━━━━━━━━
💪 DAILY (1D) ANALYSIS - Swing Trader's Powerhouse Setup
S&P; 500 on the daily timeframe is displaying STRONG BULL STRUCTURE near support zones offering clean entry opportunities this week! 🎯
━━━━━━━━━━━━━━━━━━━━━━━━━━━━━━━━━━━━━━━━━━━━━━━━━━━━━━━━━━
⚡ 4-HOUR (4H) SWING TRADE SETUP - PRIMARY ENTRY BLUEPRINT
The 4H timeframe is showing TEXTBOOK BREAKOUT FORMATION! When price closes above 6,840 with volume spike = AGGRESSIVE LONG ENTRY triggered! Ichimoku Cloud on 4H shows bullish cloud color with price above all components = strong continuation bias locked in! 📊
━━━━━━━━━━━━━━━━━━━━━━━━━━━━━━━━━━━━━━━━━━━━━━━━━━━━━━━━━━
🎯 1-HOUR (1H) INTRADAY EXECUTION ZONE - Strike Point Identified
Hourly chart displaying PERFECT CONSOLIDATION BREAKOUT PATTERN!
Trade ideas

Markets look stretched, but the S&P 500 rally isn’t over yetLooking at historical trends, there still appears to be roughly 10% more room for the S&P 500 to climb before hitting resistance. Around the 7,300 level could be where the index pauses to catch its breath, or even consolidates before the next move, which will likely be downward.
Good luck!

SPX500 Bullish Breakout!
HI,Traders !
#SPX500 is going up now
And the price broke the
Key horizontal level
Around 6695.82 and
The breakout is confimred
So we are bullish biased
And we will be expecting
A further bullish move up !
Comment and subscribe to help us grow !

SPX500 Blueprint Confirms a Bullish Flow Reversal!🏃♂️💨 SPX500 Heist: The Bullish Getaway Plan! (Swing Trade Blueprint)
The market's pulling back, but the big money is still accumulating! We've spotted a bullish setup on the SPX500, and we're planning a strategic "thief-style" entry to catch the next leg up. This isn't a reckless smash-and-grab; it's a calculated heist. 🗿
📊 The Master Plan: Technical Blueprint
Direction: 🟢 BULLISH
Trend Confirmation: Strong bullish structure confirmed by the Triangular Moving Average (TMA).
Entry Signal: We're looking for a retest and bounce from the Simple Moving Average (SMA), suggesting the pullback is a healthy accumulation phase before the next move higher.
🎯 The Heist Strategy: Execution & Logistics
🚪 Entry Protocol: "Layered Limit Orders"
We're not chasing the price. We're setting traps! Using a layered limit order strategy to average into the trade at key levels.
Suggested Buy Zones (Layer Your Orders):
Layer 1: 6780
Layer 2: 6760
Layer 3: 6740
Layer 4: 6700
Feel free to adjust the number of layers and levels based on your own risk appetite.
🚨 Escape Route: Stop Loss
Every good thief has an exit plan if the heist goes south.
Stop Loss (The Getaway Car): A break below 6680 suggests the plan is invalid. This is our "abort mission" signal.
⚠️ Note to the Thief OG's: This is my planned SL. You are the master of your own capital. Manage your risk accordingly!
💰 Profit Target: Cashing the Loot
We're aiming for a major resistance zone where the "police" (sellers) are likely waiting.
Take Profit Target: 6900
Why here? This area acts as a strong technical resistance, potentially an overbought trap. Our goal is to escape with the profits before any reversal!
⚠️ Note to the Thief OG's: This is my target. You can take money off the table whenever you see fit. Partial profits are always a smart move!
🔍 Related Markets to Watch
AMEX:SPY (SPDR S&P 500 ETF): The direct ETF tracker. Moves in near-perfect correlation.
CME_MINI:ES1! (S&P 500 E-mini Futures): The futures market often leads the price action in the index.
/ES (Micro E-mini S&P 500 Futures): A smaller contract size with the same directional bias.
NASDAQ:NDX (Nasdaq 100 Index): Often moves in tandem with the SPX; a strong NDX can pull SPX higher.
TVC:DXY (US Dollar Index): A strong inverse correlation. A weaker Dollar is generally bullish for US equities.
✨ Key Takeaways
Strategy: Bullish Swing Trade on a pullback.
Method: Layered limit order entries for optimal average price.
Catalyst: TMA & SMA support holding as accumulation zones.
Goal: Capture the move towards 6900 resistance.
✨ “If you find value in my analysis, a 👍 and 🚀 boost is much appreciated — it helps me share more setups with the community!”
Hashtags: #SPX500 #TradingSetup #SwingTrading #US500 #TradingPlan #Bullish #MarketAnalysis #TechnicalAnalysis #TradingView #ThiefStrategy

POWERFUL Quote about TradingHere is a quote I want you to write down and hold close to your heart.
Trading is a Game of Focus, Sheer Will, and Unstoppable Determination
Trading is not for the faint-hearted.
It’s a game of focus, sheer will, and the kind of determination that doesn’t back down when the market throws punches.
If you’ve been in the trading world long enough, you know it’s not about making a quick buck.
It’s about holding your ground when the waves get rough and staying in the game even when the winds are blowing against you.
Let’s break this down…
Focus Is Your Superpower
To succeed, you need to zero in on your strategy and trust the process, no matter how loud the noise around you gets.
Focus is what separates a good trader from a great one.
It’s about staying laser-focused on your plan.
Do not get rattled when the market throws a curveball.
If you’re jumping from one strategy to another or chasing every shiny new stock, you’re spreading your energy too thin.
And in trading, scattered focus equals scattered results.
How to Strengthen Your Focus:
Create a daily routine and stick to it. Consistency fuels discipline.
Set specific trading goals for each session.
Block out distractions. Social media can wait.
Review your trades regularly to keep your mind sharp.
Sheer Will Gets You Through the Tough Times
Let’s not sugarcoat it:
There will be rough patches.
Trading will test you.
Your willpower will be stretched like a rubber band, and sometimes it might snap.
But those who make it are the ones who refuse to quit.
There’s a misconception that the best traders are the ones who never lose. Wrong.
The best traders are the ones who keep getting back up.
You will lose trades.
It’s part of the game.
But if you have the will to persist, those losses become your greatest teachers.
Ways to Build Your Willpower:
Start small. Set short-term, achievable goals to build momentum.
Learn from each mistake. Losses are part of the learning curve.
Celebrate your progress, even if it’s slow.
Stay connected with other traders to keep motivated.
Determination is Your Guiding Force
What makes a trader stick to their plan even when everything seems to be going wrong?
Determination.
It’s that relentless drive to keep going no matter what.
It’s about having a clear vision of where you’re headed and refusing to let setbacks derail you.
Determination means playing the long game.
It’s easy to get discouraged after a few losses or slow weeks, but successful traders know that big wins take time.
You’ve got to be in it for the long haul.
Strengthening Your Determination:
Write down your trading goals and review them daily.
Make sure you have checked the US Economic calendar with your trading strat.
Remind yourself of why you started trading in the first place.
Don’t let a losing streak shake your confidence—adjust, don’t abandon.
Stay flexible but committed to your strategy.
Conclusion: Keep Grinding, Keep Growing
Trading is a game of focus, sheer will, and relentless determination.
It’s not easy, but if you can master these qualities, you’ll find yourself ahead of the pack.
Success in trading doesn’t come from luck or overnight gains.
It comes from grinding it out, day after day, with a sharp mind and an unbreakable spirit.
Remember, the markets will test you.
They’ll try to break your focus, test your will, and challenge your determination.
But if you stay committed, keep your focus razor-sharp, and push through the tough times, you’ll come out stronger, smarter, and more successful.
So, what are you waiting for?
Tighten up your focus, flex that willpower, and get ready to tackle the markets with unstoppable determination.

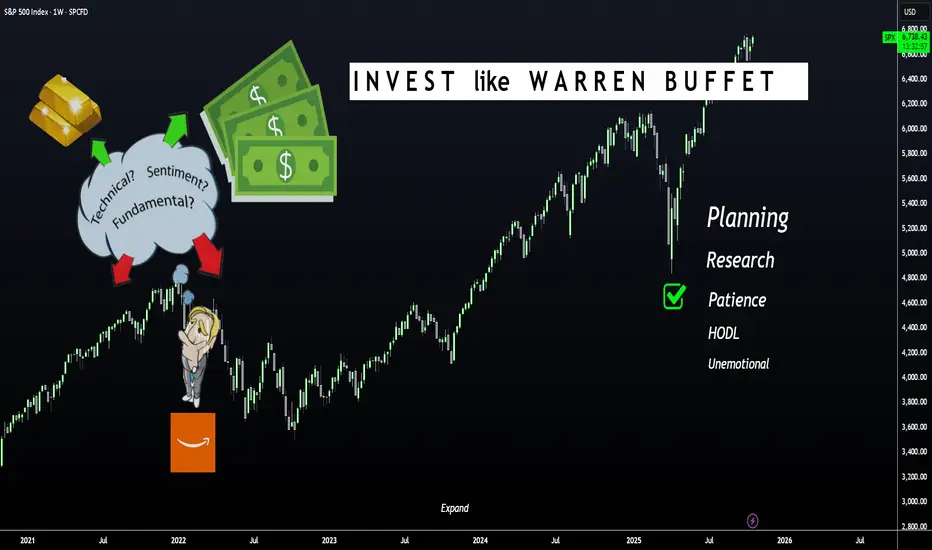
LEARN to INVEST Like Warren BuffetHello Stock Traders and Speculators 📈📢
If you trade and or watch stocks, commodities and/or ETF's then this one is for you!
Warren Buffett is probably one of the most successful investors of all time. Over the years, he has developed a set of principles and strategies over his career. He was inspired by the teachings of key financial thinkers like Phil Fisher, Benjamin Graham and Charlie Munger.
Phil Fisher
Fisher’s approach focusses on quality companies with long-term growth potential, emphasizing focused portfolios and long-term holdings. He believed in gathering information about a company beyond what’s readily available. His lessons on maintaining a focused portfolio and committing to long-term holdings are clear influences on Buffett’s patient, value-driven investment philosophy.
Benjamin Graham
Known as the father of value investing, Graham’s core principle was to buy stocks at a price lower than their intrinsic value, creating a margin of safety (MOS). This strategy helps mitigate risk and increase the likelihood of future gains. Buffett absorbed Graham’s teaching on finding stocks that are undervalued and buying them at the right price— definitely a large contributor of his investment success.
Charlie Munger
Munger is Warren Buffett’s long-time business partner. He introduced the concept of economic moats, which refers to a company’s long-term, sustainable competitive advantages. Munger advocates investing in businesses that can fend off competition and maintain profitability over time. This philosophy drives Buffett’s focus on companies with strong market positions and solid long-term potential, favoring these over shorter-term, speculative opportunities.
Buffett's Investment Approach
1 - Buy for the Long Term. Buffett’s strategy emphasizes identifying companies that can consistently perform well over long periods. He holds stocks for years, or even decades, often looking for opportunities where other investors may overlook value.
2 - Buy at the Right Price. Buffett is known for his discipline in waiting for the right moment to invest. His approach ensures he doesn’t overpay, instead seeking stocks when they are priced below their true value, maintaining a margin of safety.
3 - Buy the Right Stocks. Buffett doesn’t just buy cheap stocks, he buys quality companies with sustainable advantages. His goal is to invest in firms with strong business models that will continue to perform well regardless of market conditions.
Warren Buffett emphasizes investing in companies with simple and clear business models, ones that fall within his circle of competence. He prefers to thoroughly understand the operations, products, and long-term prospects of a company before making any investment.
This principle is combined with in-depth analysis of how the company operates and how sustainable its valuations and future growth prospects are. If a business model is too complex or outside his expertise, he avoids it.
He prioritizes companies with integrity and transparency in their management. He believes in backing leaders who are passionate, have strong vision and execution capabilities and who use shareholder funds wisely. Trusting management to run the company effectively, with efficiency and accountability, is critical for long-term success in Buffett’s eyes.
Investing in quality companies isn’t enough—Buffett also insists on buying them at attractive prices. He maintains a strict discipline of buying with a margin of safety, ensuring the price paid is lower than the company’s intrinsic value. This means waiting for opportunities to buy great businesses at fair prices rather than settling for fair businesses at attractive prices, which may not perform well over time.
Buffett has made many of his lessons and strategies available to the public through his letters to shareholders and partnership letters. These documents offer insight into his investment approach, decision-making process, and lessons from both successes and failures. There are several key books that capture Buffett’s life, philosophy, and strategies in greater detail:
📚Warren Buffett’s Ground Rules
📚The Warren Buffett Way
📚Buffett: The Making of an American Capitalist
📚The Warren Buffett Portfolio
📚The Snowball: Warren Buffett and the Business of Life
Each of these resources provides a comprehensive look into the mind of one of the most successful investors of all time. Personally I've read Buffett: The Making of an American Capitalist by Roger Lowenstein and it is fantastic.
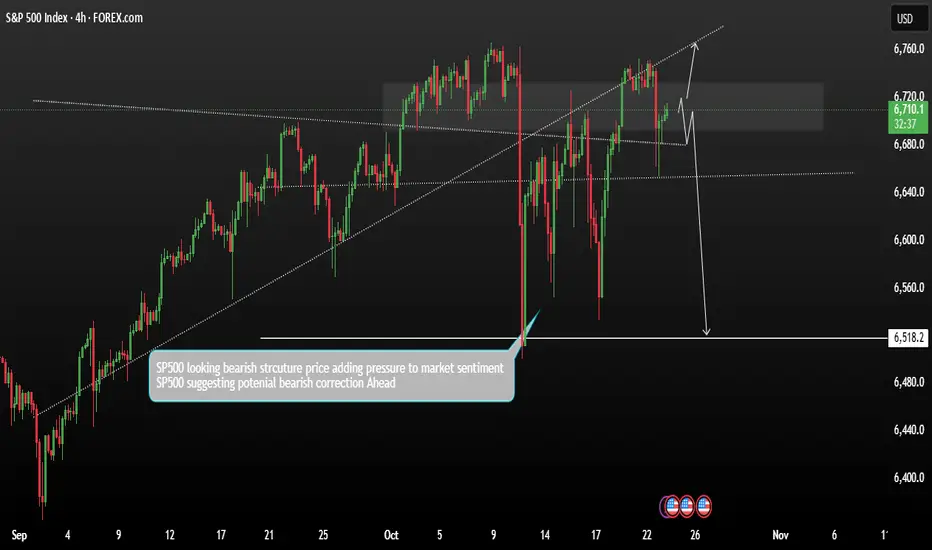
SP500 currently showing bearish trend structureThe NASDAQ 100 is currently showing signs of price consolidation within a bearish trend structure. Selling pressure continues to build as price action remains capped below key resistance levels.
While short-term fluctuations may occur during earnings releases, technical indicators suggest that the bearish bias remains intact unless the price breaks decisively above resistance. Traders should watch for reversal signals around current resistance before considering short positions.
A Price is testing the upper resistance, suggesting that momentum may be losing steam The broader bias remains bearish, with sellers likely to regain control if the resistance holds a potential downside move could target the 6518 level, provided the market confirms rejection from resistance.
You may find more details in the chart.
Trade wisely best of Luck Buddies.
Ps; Support with like and comments for better analysis Thanks for Supporting.
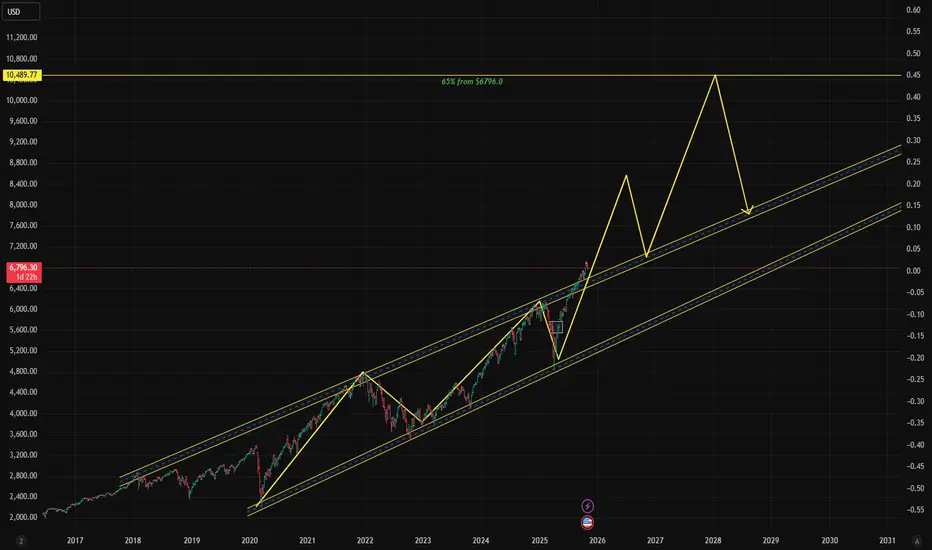
$SPX Hi, we are back with another one: SP:SPX !!!
As we can see we have SP:SPX sitting at $6796.30 with and expectation for a 65% pump.
That would bring us around $9-$10K per 1 SP:SPX .
Wouldn't that be incredible if we can see this by 2026 -2028 ?
What a time to be alive no ?
Don't forget to comment like and share for good luck :) !!!
$SPX: MACD has triggered a sell signal. SP:SPX : While today's bounce started off promising, it ultimately fell short. It was unable to break above and reclaim the 10-day moving average, and today, the MACD generated a sell signal. However, before drawing any definitive conclusions, it’s essential to keep things in perspective. So far, this downward movement could be seen as a simple pullback. The S&P 500 has reached the 0.382 retracement level, and it's crucial to note that the 20-day simple moving average would need to be breached to increase the likelihood of a further decline.

SPX moneyPrice make a foundation low then pullback creating short term uptrend eventually coming to an end. Following price fell and make a new external low. Waited for price to come back to the last time buyers were in control and in discount to take us to the external low. Same play... continuation.

V Pattern In SPX/USDHey fellow traders and followers! Look what I found on the 8hr SPX chart.
Looks like a developing V pattern so far. What could that mean ?
Means up to me.
Here are the numbers; We need to break and hold above the Break Line of 6873.1 area to solidify a long position to Target 1) 6939.7
Target 2) 6966.7
I can't stress enough the importance of the Break Line area being a solid support in order for the trade to have a 8 out of 10 chance to make you money. This move if reached fetches a nice profit $$$ Just look at the points you can gain where I posted it on the chart.
Ok, let's see how things play out... See you at the starting gate $$$

SPX Breaks Down: Tech Momentum Cools as Risk-Off Sentiment BuildThe S&P 500 just broke below its short-term descending channel — confirming selling pressure is building. High-valuation tech and AI names like NASDAQ:NVDA , NASDAQ:MSFT , NASDAQ:GOOGL , NASDAQ:MU , and NASDAQ:PLTR are leading the pullback as investors rotate out of crowded trades.
Macro headwinds — Fed uncertainty, stretched valuations, and global weakness — are weighing on sentiment. Near-term bias stays bearish unless SP:SPX can reclaim 6,850.

Stock market today : Where are SPX500 and Nasdaq headed today.As of now, there are more bear factors than bull factors which are poised to pull the market downwards unless something changes.
Negative Factors:
1. BTC is bleeding.
2. 1882/2739 stocks are declining. (that is whopping 68.7%)
3. 981 stocks of NYSE are near or at new lows.
4. Sector composite is negative.
5. Macro State is under stress...
Positive Factors:
1. VIX is cooling down
2. DXY is slightly up
3. Financial Stocks are neutral.
4. US10Y is declining.
5. Gold is declining
6. Oil is under stress.
Down probability: 64%
Up Probability: 36%
Track these factors in real time to get wind of the market's sudden U Turns or minor pull backs.

Monthly CloseS&P500 Timeframe H6 - Since the open this week we have been hovering around the 6,000 mark which is currently acting as a psychological level. Is there more upside to come before the end of the monthly candle close or are we going to see another bounce lower from this zone like we did last week?

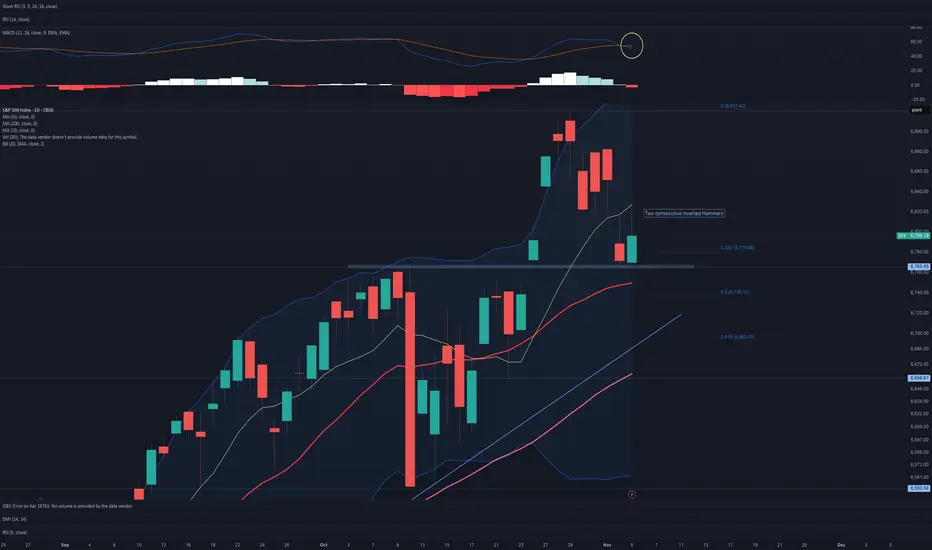
SPX500 longMarket Structure
Overall trend on higher timeframes (H1–H4) remains bearish — you can see a strong impulse down, then a current range/consolidation phase.
The lower low was formed near the 6 730s (bottom gray zone).
Price is now consolidating just above that liquidity zone — showing accumulation before a possible short-term correction upward.
🔹 Key Zones
Demand zone (orange + gray lower area)
→ This is where the previous bearish leg ended.
→ Several candle rejections show liquidity absorption from sellers.
Internal Range
Equal highs marked by green line — liquidity built up for potential sweep.
Equal lows marked by orange line — base of current accumulation.
Supply zone (gray upper area)
Between 6 795 – 6 815.
This zone was the origin of the last strong bearish displacement, so it’s your target zone for a possible pullback or continuation rejection.

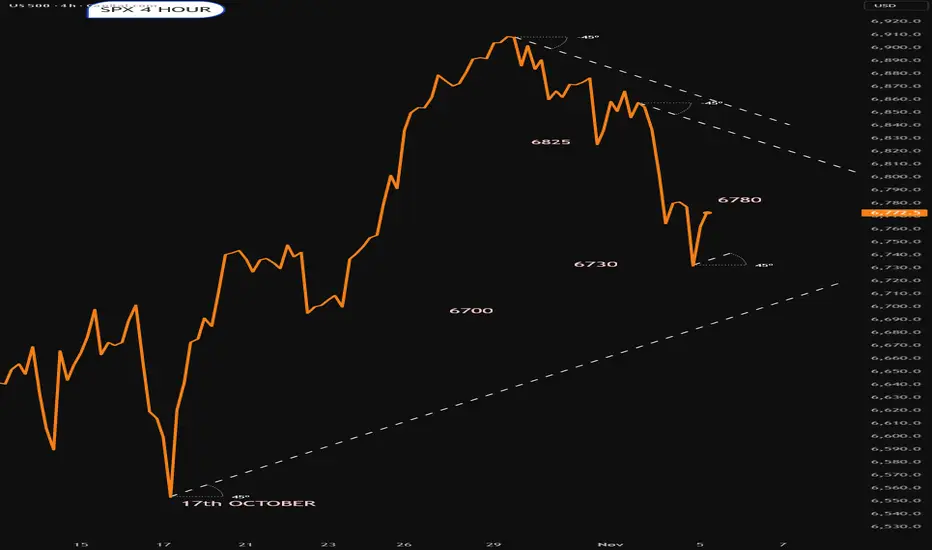
SPX updated for November 5thTrying to bounce.Plenty of resistance
Bulls will want to keep it above 6700
November 5th a big day over here in the UK.420 years ago Guy Fawkes tried to blow up our parliament.He and his gang were caugh ton 5th Novemeb3r 1605
Key Pillars of Global Market SuccessKey Pillars of Global Market Success
In the modern interconnected world, success in the global market depends on much more than simply exporting products or services across borders. It involves mastering an ecosystem of strategies, competencies, and adaptability that allows businesses to thrive amid fierce competition, diverse consumer preferences, evolving technology, and changing regulations. Understanding the key pillars of global market success is crucial for any organization that aims to expand internationally, build a sustainable brand, and maintain long-term growth.
Below are the fundamental pillars that support success in the global marketplace.
1. Strong Market Research and Cultural Understanding
Before entering any foreign market, businesses must conduct thorough market research to understand the local culture, consumer behavior, economic environment, and regulatory structure. This goes beyond studying demographics or income levels; it involves understanding cultural nuances, preferences, and purchasing habits.
For instance, a marketing strategy that works in the United States may fail in Japan or India because of differences in communication style, color symbolism, and social norms. Companies like McDonald’s and Coca-Cola have succeeded globally because they localize their products — offering the McPaneer burger in India or tea-based beverages in China.
Effective market research also helps identify:
Consumer trends and unmet needs
Competitor strategies
Pricing expectations
Distribution challenges
Ultimately, cultural intelligence — the ability to adapt to local customs while maintaining a global identity — is one of the strongest foundations for global market success.
2. Product Innovation and Adaptability
Innovation is the lifeblood of global competitiveness. Successful global companies are those that continuously innovate to meet diverse consumer demands and rapidly changing technologies.
However, innovation must be combined with adaptability. A product that dominates one region may need to be redesigned for another. For example, automobile manufacturers often modify car designs for local road conditions, fuel quality, and climate. Similarly, software companies translate and localize their user interfaces for different languages and legal frameworks.
The key is to build a balance between standardization and customization. Standardization offers economies of scale and a unified brand identity, while customization ensures relevance in local markets.
Innovative adaptability also includes:
Sustainable product design
Integration of digital technologies
Customer-centric product development
Innovation and adaptability ensure that companies remain competitive, responsive, and resilient to global shifts in demand.
3. Effective Global Strategy and Vision
Every successful international business is built upon a clear strategic vision. This vision outlines why the company is expanding globally, where it intends to grow, and how it plans to achieve that growth.
A global strategy must align with the company’s core competencies while considering:
Market entry modes (exporting, franchising, joint ventures, acquisitions)
Localization vs. standardization decisions
Long-term investment and operational models
Supply chain and logistics networks
For instance, companies like Apple and Toyota have achieved success because of their well-defined global strategies that focus on efficiency, innovation, and customer experience.
Strategic clarity allows companies to avoid costly mistakes — such as entering markets without understanding local regulations or underestimating cultural resistance. It ensures that every move supports the company’s broader vision of global growth and brand leadership.
4. Strong Brand Identity and Reputation
A strong brand transcends borders. Global market success depends heavily on how consumers perceive and trust a brand. Reputation, once built, becomes a key competitive advantage that drives loyalty and market expansion.
Companies that consistently deliver quality, ethical practices, and transparency earn the trust of global customers. Apple, Nike, and Samsung are examples of brands that represent innovation, quality, and status — values that resonate worldwide.
Brand success in the global market also depends on:
Consistent brand messaging across cultures
Localized marketing campaigns that reflect local values
Corporate social responsibility (CSR) initiatives that enhance goodwill
Emotional connection through storytelling and authenticity
A powerful global brand acts as a bridge across cultures and markets, allowing companies to command premium prices and sustain long-term relationships.
5. Efficient Supply Chain and Operations Management
Operational efficiency and a resilient supply chain are vital for global competitiveness. The ability to source materials globally, manufacture efficiently, and deliver products on time defines a company’s success in international markets.
A robust supply chain ensures:
Cost optimization through global sourcing
Speed and flexibility in responding to market changes
Risk mitigation against disruptions such as geopolitical tensions or pandemics
Technological integration — such as blockchain for transparency or AI for demand forecasting — has revolutionized global supply chain management.
Companies like Amazon and Unilever have mastered this pillar by building logistics networks that span continents, supported by data analytics and automation. These efficiencies not only improve profitability but also enhance customer satisfaction and competitiveness.
6. Financial Strength and Risk Management
Global expansion requires significant financial resources. Success depends not only on investment capacity but also on the ability to manage risks such as currency fluctuations, inflation, political instability, and trade policy changes.
Companies must establish:
Hedging strategies for currency and interest rate volatility
Diversified revenue streams to offset regional downturns
Robust financial planning for taxation, compliance, and cost management
Financial resilience allows businesses to withstand global shocks, like the COVID-19 pandemic or trade wars, while continuing operations and maintaining investor confidence.
Additionally, access to global financing options — such as international bonds, venture capital, and foreign direct investments (FDIs) — strengthens a company’s ability to scale operations and explore new markets.
7. Talent Management and Cross-Cultural Leadership
Human capital is one of the most valuable assets in global success. Managing a diverse, cross-cultural workforce requires leadership that understands different values, work ethics, and communication styles.
Successful global firms emphasize:
Cross-cultural training for employees
Inclusive leadership that values diversity
Decentralized decision-making for regional responsiveness
Talent mobility programs to develop global leaders
For example, multinational companies like Google and IBM encourage internal global mobility, allowing employees to experience different cultures and bring innovative ideas to their roles.
Building global teams also enhances creativity, problem-solving, and adaptability — qualities essential for sustained success in international markets.
8. Technology Integration and Digital Transformation
Digital transformation is no longer optional; it is the backbone of modern global business success. Companies that leverage technology for marketing, operations, analytics, and customer engagement gain a massive advantage.
Key technological enablers include:
Artificial Intelligence (AI) for predictive analytics and automation
Big Data for consumer insight and personalized marketing
Cloud computing for scalable operations
E-commerce platforms for global reach
Digitalization allows even small and medium enterprises (SMEs) to compete internationally without the need for large physical infrastructure.
For instance, Shopify and Alibaba have enabled countless businesses to access global markets through online stores, while advanced logistics and digital payment systems simplify global trade transactions.
Thus, technology acts as both a driver of innovation and an equalizer that lowers barriers to global market entry.
9. Legal and Ethical Compliance
Operating globally requires strict adherence to international laws, trade agreements, and ethical standards. Failure to comply can lead to heavy penalties, brand damage, or even market bans.
Key compliance areas include:
Trade regulations and import/export duties
Data protection and privacy laws (e.g., GDPR in Europe)
Environmental sustainability standards
Anti-corruption and fair competition laws
Ethical conduct, corporate transparency, and sustainability practices are now essential for brand reputation and investor trust. Companies that integrate Environmental, Social, and Governance (ESG) principles attract more customers and long-term investors.
A responsible global business does not merely chase profit; it contributes to global well-being and sustainable development.
10. Customer-Centric Approach and Relationship Building
At the heart of global market success lies one universal truth — the customer is king. Businesses that place customers at the center of their strategy are more likely to succeed globally.
This involves:
Listening to customer feedback from diverse markets
Offering localized support and services
Using data analytics to personalize offerings
Building long-term trust rather than focusing solely on short-term sales
Companies like Amazon, Netflix, and Starbucks excel because they continuously adapt their customer experience using data-driven insights. A strong customer relationship not only drives loyalty but also builds powerful word-of-mouth reputation in new markets.
11. Sustainability and Social Responsibility
Modern consumers, investors, and regulators increasingly expect businesses to operate sustainably. Environmental and social responsibility is no longer a marketing choice but a business imperative.
Sustainability includes:
Reducing carbon footprint and waste
Ethical sourcing of raw materials
Supporting community development
Transparent ESG reporting
Brands that align their operations with global sustainability goals (like the UN Sustainable Development Goals) not only attract conscious consumers but also secure long-term stability by reducing regulatory risks.
Companies like Tesla, Patagonia, and Unilever have demonstrated how sustainability can be integrated into the business model while maintaining profitability.
12. Continuous Learning and Adaptation
The global market is dynamic — what works today may not work tomorrow. Continuous learning, innovation, and adaptation are the final and most enduring pillars of success.
Businesses must stay alert to:
Technological disruptions (AI, automation, blockchain)
Changing trade policies and tariffs
Evolving consumer expectations
Economic and geopolitical shifts
Agile companies that embrace change, experiment, and learn from failures can sustain success in the ever-evolving global landscape.
Conclusion
Global market success is not built overnight. It requires a combination of strategic clarity, cultural understanding, innovation, and resilience. The twelve pillars discussed above — from research and adaptability to sustainability and learning — form an integrated framework that helps businesses expand internationally while maintaining a strong competitive edge.
The global marketplace rewards those who can balance local relevance with global vision. Companies that invest in people, technology, ethics, and innovation not only achieve profitability but also become agents of positive global change.
In essence, the true measure of global market success lies in creating lasting value — for customers, employees, communities, and the planet — while navigating an ever-changing world with agility and integrity.


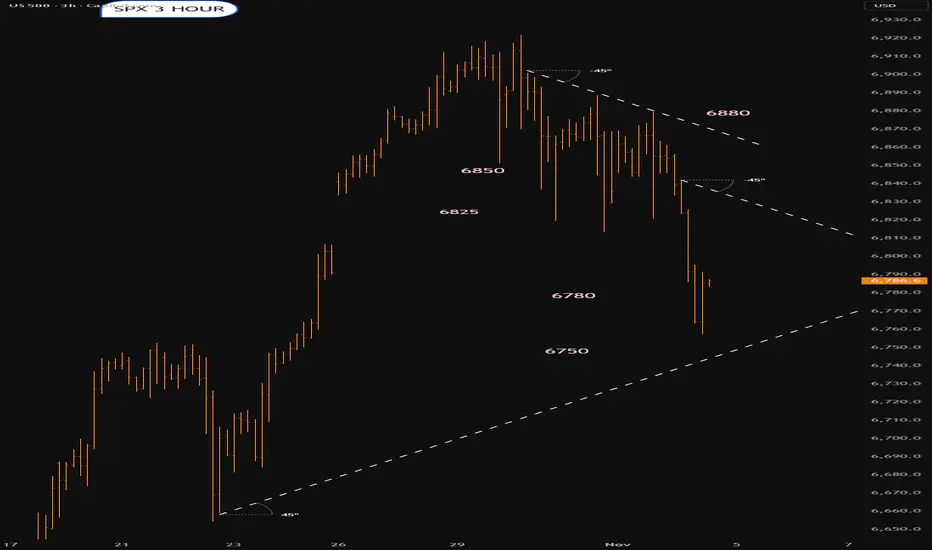
SPX | Daily Analysis #11 - 4 November 2025Hello and Welcome back to DP
Review and News Coverage:
As mentioned in the previous daily analysis, the market saw a nice decline — even breaking through the 6811 area and reaching down to 6766. There wasn’t any major news driving the move; it seems the market simply took a breather to gather strength for the next potential rally.
Now that the past move is complete, our focus shifts forward. Tomorrow brings key economic events — NFP (Non-Farm Payrolls) and PMI data — both of which are likely to bring significant volatility to the market.
1H Time Frame Technical Analysis:
At the moment, this bull run could face resistance around the 6826 area. From there, a short-term correction toward the 6800 zone is possible (6811 is no longer relevant).
Personally, I believe the recent downside move has finished, and we should now start looking for buy opportunities. If the price retraces and holds above 6800, it could open the door for long entries and a continuation of the bullish move.
Summary:
• Resistance: 6826
• Support: 6800
• Bias: Bullish (Buy on dips)
• Key Events Tomorrow: NFP & PMI — expect high volatility
Disclaimer:
This content is for informational purposes only and does not constitute financial or investment advice. © DIBAPRISM
Amir D.Kohn

Maximum profit: Top 5 indices of OctoberIn October, client activity peaked around #SP500, #NQ100, #DAX30, #FTSE100, and #NIKKEI . These five indices not only showed the highest share of profitable trades but also delivered the best returns across all index instruments. Strong corporate earnings, steady demand, and a positive news backdrop continue to support their growth potential.
Growth outlook for key indices through the end of 2025:
• #SP500: New record highs, solid earnings from major players, and expectations of a Fed rate cut support buying the dip with moderate risk.
• #NQ100: Tech demand remains strong as firms invest in data centers and AI infrastructure. If earnings stay on track, there’s still room to grow.
• #DAX30: After hitting new all-time highs in 2025, the German index benefits from improved global trade sentiment and stable EU data. Exporters thrive on robust external demand.
• #FTSE100: The UK market remains near its highs, supported by strong performance in key sectors and commodities. Year-end liquidity may further reinforce the uptrend.
• #NIKKEI: Japan’s index keeps climbing, helped by a weak yen boosting exports and a predictable monetary environment. Further gains are possible if global conditions remain calm.
FreshForex analysts believe short-term index performance hinges on three main factors: current earnings season results, inflation trends, and central bank decisions. Risk management and awareness of the macro calendar remain essential.

SPX into the open 4th NovemberPossible support areas marked
Resistance...Not really clear
Will it get bought.?