AUDUSD Daily FRGNT Forecast - Q4 | W42 | D13 | Y25|📅 Q4 | W42 | D13 | Y25|
📊 AUDUSD Daily Forecast
🔍 Analysis Approach:
I’m applying Smart Money Concepts, focusing on:
Identifying Points of Interest on the Higher Time Frames (HTFs) 🕰️
Using those POIs to define a clear trading range 📐
Refining those zones on Lower Time Frames (LTFs) 🔎
Waiting for a Break of Structure (BoS) for confirmation ✅
This method allows me to stay precise, disciplined, and aligned with the market narrative, rather than chasing price.
💡 My Motto:
"Capital management, discipline, and consistency in your trading edge."
A positive risk-to-reward ratio, paired with a high win rate, is the backbone of any solid trading plan 📈🔐
⚠️ Losses?
They’re part of the mathematical game of trading 🎲
They don’t define you — they’re necessary, they happen, and we move forward 📊➡️
🙏 I appreciate you taking the time to review my Daily Forecast.
Stay sharp, stay consistent, and protect your capital
— FRNGT 🚀
FX:AUDUSD
Trade ideas

AUDUSD Trade Plan 13/10/2025Dear Traders,
The Australian dollar is still within its long-term upward channel. Considering my expectation of a stronger U.S. dollar and the ongoing tariff war between the U.S. and China, a weakening of the Australian dollar seems likely. The highlighted zones have the potential for a reversal or a breakout of the multi-month channel.
Regards,
Alireza!

AUDUSD H4 | Approaching a Confluence Resistance LevelBased on the H4 chart analysis, we could see the price rise to the sell entry which is an overlap resistance that is slightly below the 61.8% Fibonacci retracement and could reverse from this level to the downside.
Sell entry is at 0.6549, which is an overlap resistance that is slightly below the 61.8% Fibonacci retracement and could reverse from this level to the downside.
Stop loss is at 0.6620, which acts as a multi-swing high resistance.
Take profit is at 0.6469, which is a pullback support.
High Risk Investment Warning
Trading Forex/CFDs on margin carries a high level of risk and may not be suitable for all investors. Leverage can work against you.
Stratos Markets Limited (tradu.com ):
CFDs are complex instruments and come with a high risk of losing money rapidly due to leverage. 65% of retail investor accounts lose money when trading CFDs with this provider. You should consider whether you understand how CFDs work and whether you can afford to take the high risk of losing your money.
Stratos Europe Ltd (tradu.com ):
CFDs are complex instruments and come with a high risk of losing money rapidly due to leverage. 66% of retail investor accounts lose money when trading CFDs with this provider. You should consider whether you understand how CFDs work and whether you can afford to take the high risk of losing your money.
Stratos Global LLC (tradu.com ):
Losses can exceed deposits.
Please be advised that the information presented on TradingView is provided to Tradu (‘Company’, ‘we’) by a third-party provider (‘TFA Global Pte Ltd’). Please be reminded that you are solely responsible for the trading decisions on your account. There is a very high degree of risk involved in trading. Any information and/or content is intended entirely for research, educational and informational purposes only and does not constitute investment or consultation advice or investment strategy. The information is not tailored to the investment needs of any specific person and therefore does not involve a consideration of any of the investment objectives, financial situation or needs of any viewer that may receive it. Kindly also note that past performance is not a reliable indicator of future results. Actual results may differ materially from those anticipated in forward-looking or past performance statements. We assume no liability as to the accuracy or completeness of any of the information and/or content provided herein and the Company cannot be held responsible for any omission, mistake nor for any loss or damage including without limitation to any loss of profit which may arise from reliance on any information supplied by TFA Global Pte Ltd.
The speaker(s) is neither an employee, agent nor representative of Tradu and is therefore acting independently. The opinions given are their own, constitute general market commentary, and do not constitute the opinion or advice of Tradu or any form of personal or investment advice. Tradu neither endorses nor guarantees offerings of third-party speakers, nor is Tradu responsible for the content, veracity or opinions of third-party speakers, presenters or participants.

AUDUSD SELLAUDUSD - Distribution
I think we could see a repeat of trade tensions, which could allow for some downside on AUDUSD and for the distribution to finally take place.
We are seeing some breaks in structure, and I'll be closely watching for some confirmation on a pullback.
Let's see I could be wrong !!!

Bearish drop off?The Aussie (AUD/USD) could rise to the pivot and could reverse to the 1st support which is an overlap support.
Pivot: 0.6543
1st Support: 0.6383
1st Resistance: 0.6680
Disclaimer:
The above opinions given constitute general market commentary, and do not constitute the opinion or advice of IC Markets or any form of personal or investment advice.
Any opinions, news, research, analyses, prices, other information, or links to third-party sites contained on this website are provided on an "as-is" basis, are intended only to be informative, is not an advice nor a recommendation, nor research, or a record of our trading prices, or an offer of, or solicitation for a transaction in any financial instrument and thus should not be treated as such. The information provided does not involve any specific investment objectives, financial situation and needs of any specific person who may receive it. Please be aware, that past performance is not a reliable indicator of future performance and/or results. Past Performance or Forward-looking scenarios based upon the reasonable beliefs of the third-party provider are not a guarantee of future performance. Actual results may differ materially from those anticipated in forward-looking or past performance statements. IC Markets makes no representation or warranty and assumes no liability as to the accuracy or completeness of the information provided, nor any loss arising from any investment based on a recommendation, forecast or any information supplied by any third-party.

AUDUSD – Weekly FRGNT Forecast -Q4 | W42 | Y25📊 AUDUSD – Weekly Forecast
💡 Weekly FRGNT Insight
Q4 | W42 | Y25
Weekly Outlook 🔍📅
Here’s a concise breakdown of the current market structure 🧠📈
Higher time frame order blocks have been identified — these remain our key points of interest for potential reactions 🎯🧭.
Patience is key:
Wait for a confirmed break of structure (BOS) 🧱✅ before forming a directional bias. This keeps us disciplined and aligned with what price action is actually showing — not what we want to see.
📈 Risk Management Protocols
🔑 Core principles:
-Risk no more than 1% per trade
-Execute only at pre-identified levels
-Let alerts, not emotions, guide decisions
-Maintain your minimum 1:3 RR plan
🧠 Remember: You’re not paid for how many trades you take, but for how well you manage risk.
“Trade what the market gives — not what your ego wants.”
Stay mechanical. Stay focused. Let the probabilities play out.
FRGNT
FX:AUDUSD

AUDUSD ANALYSIS -10/12/25U.S. continues to see a government shutdown. This has strongly impacted AUDUSD in the past week. Take a look at my analysis.

"AUD/USD Breakout | Bullish Robbery to Overbought Resistance"🚨💰🦘 AUD/USD "The Aussie" Forex Bank Heist 💰🚨
Oi mates & fellow market robbers! 🏴☠️💵
This is your Thief Trader breaking into the Aussie vault — and this time, the loot is in pips, not gold bars. 😎
💥 MISSION PLAN: Bullish raid with layered limit orders — stacking like a pro safecracker. No hesitation, no mercy. Entry? Any price the vault door swings open. 📈🔓
📍 ENTRY:
🎯 Slip in at ANY level, but a true thief knows how to wait for the pullback sweet spots. Layer the buys like bricks in a getaway tunnel.
🛑 STOP LOSS:
🚔 Park it at 0.64900 — our last escape hatch before the police sirens get too close.
🎯 TARGET:
💣 0.66200 — POLICE BARRICADE RESISTANCE ZONE 🚧🔥 Overbought territory where the getaway chopper is waiting.
📊 Why the Aussie vault is ripe for robbery:
Bullish momentum is loading up like a cash van before payday. 💵
Big players pushing price higher — we just tailgate the convoy. 🚚💨
Layering entries means more bags filled if the price dips before liftoff. 🛍️
⚠ Robbery Rules:
Avoid news time unless you love chaos. 📢
Keep SL tight and respect the plan — greedy thieves get caught.
Trailing stop = locking loot while the ride continues.
💖 Boost this heist plan if you’re rolling with the crew! 🚀💰 The more likes, the louder the sirens, the bigger the thrill.
🏆 Stay sharp, stay sneaky, and let’s rob the Aussie bank together! 🐱👤💸

AUDUSD IDEA Price is currently a support area on the 4H timeframe. If this area holds, I'm expecting price to test the downwards trend line before continuing with the bearish momentum down to the 0.64200 support.

AUDUSD LONG I believe price has broken structure to the upside indicating a clear uptrend movement, now price should fill the unmitigated supply level and give us a move back to the upside to continue the trend FOREXCOM:AUDUSD

AUDUSD SET UP Based on the technical analysis it seems to be a bullish move on the #AUDUSD price, which is retracing to a very key area on the daily, four-hour, two-hour and one-hour timeframes, this is an excellent confirmation that the price is about to surge high. I am optimistic about the bull move on AUDUSD in the coming weeks

AUDUSD | Bearish Rejection from Order Block – Target doneHello Billionaires!!
In AUDUSD just delivered a clean Smart Money bearish setup — rejecting from the FVG + Order Block (OB) zone in premium pricing.
After taking the Buy Side Liquidity (BSL), price shifted structure and is now aggressively heading toward the BPR & SSL zone below.
Every pullback is now a chance for Smart Money to sell at premium levels 🚀
📊 Market Storyline:
BSL taken, confirming liquidity grab ✅
FVG + OB rejection in premium ✅
Structural shift to bearish order flow ✅
Target → SSL liquidity zones ✅
Smart Money stays one step ahead — retail still looking for longs 😏
#AUDUSD #AliyanFX #SmartMoneyConcepts #ICT #PriceAction #Liquidity #FVG #BPR #OB #SMC #Forex #TradingViewIdeas

AUDUSD--SHORT--bearish continuation
--monthly bearish
--weekly bearish
--daily bearish
--entry and tp levels are as shown on the chart

AUDUSD analysis - 2H FVG and OB SetupsMarket: AUDUSD (2H) — Current price ~ 0.6605
Key Zones
Sell OB (4H) — 0.6615 – 0.6650 (red). Primary supply to watch.
Daily OB (higher) — 0.6700 – 0.6740 (stronger supply above).
Demand / D POC (daily) — 0.6485 – 0.6510 (green). First major demand area.
Lower OB (4H) — 0.6420 – 0.6440 (secondary demand).
Market Scenarios
Probable (shallow pull → demand test):
Price may test the 0.6615–0.6650 supply and then correct down to 0.6485–0.6510 (D POC) to collect bids. Look for lower-timeframe confirmation (3m/5m) for lower-risk long entries.
Bullish continuation (break & follow-through):
If the 0.6615–0.6650 zone is broken with momentum (no fakeout), expect continuation to the Daily OB at 0.6700–0.6740.
Deeper pull (bear-favored short-term):
Failure at D POC could open a path to the lower OB around 0.6420–0.6440 — another potential buy area if we see clean reaction and confirmations.
Risks & Notes
Fake-break risk at supply zones — do not trade the break without confirmation.
Watch AUD / USD macro/news events — they can accelerate moves and invalidate setups.
Prefer taking entries on confirmed reactions on lower TFs. Avoid aggressive entries inside supply without confirmation.

AUDUSDFriday witnessed a big sell. I will watch closely to see any bullish signal as this down move is too sharp, and the DTF IFVG just right there. I target the zone from 0.64500 to 0.64100 for a buy but wont hold long, unless I see the price breaks the previous consolidation to go higher.

AUDUSD Will Go Down!
HI,Traders !
#AUDUSD already made a
Retest of the horizontal
Level of 0.66145 from where
We are already seeing a
Bearish reaction so we
Will be expecting a
Further bearish move down !
Comment and subscribe to help us grow !

AUDUSD Wave Analysis – 10 October 2025
- AUDUSD broke support level 0.6525
- Likely to fall to support level 0.6410
AUDUSD currency pair recently broke the support zone between the support level 0.6525 (low of wave (1) from September), 61.8% Fibonacci correction of the upward impulse (C) from August and the support trendline from April.
The breakout of this support zone accelerated the active intermediate impulse wave (3).
Given the strongly bullish US dollar sentiment seen today, AUDUSD currency pair can be expected to fall to the next support level 0.6410 (former low of wave (B) from August).

AUDUSD what a move TPIf you check my post you'll see when I posted about this
Thou I didn't wait for the TP to hit but I was sure 100%
Some people sent me a dm saying they held that's fine
At the end of the day we all want something from the market
Congratulations if you took it

AUDUSD short This pair created a reversal pattern
Double top on the higher timeframe
On the lower time frame it created a continuation from the neckline confirming neckline breakout.
The pair is continuing in its down trend.

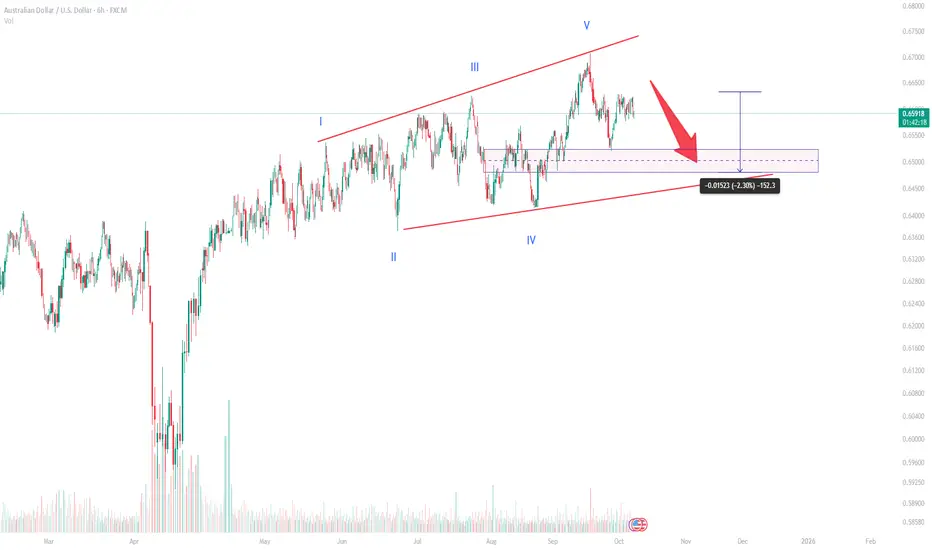
Rising Diagonal Pattern Near CompletionAUD/USD Elliott Wave Analysis – Rising Diagonal Pattern Near Completion
Overview
The AUD/USD pair has formed a clear ending diagonal pattern, signaling potential exhaustion of the current bullish trend. This structure, often seen at the final stage of an impulse wave, suggests that a corrective phase may soon follow. The diagonal appears complete with all five internal waves labeled (I-V), indicating that the market might be preparing for a deeper pullback.
Technical Analysis
According to the Elliott Wave structure visible on the 6-hour chart, AUD/USD completed its fifth and final wave near the 0.67 region. The wedge pattern is now narrowing, with bearish divergence hinting at weakening bullish momentum.
Wave Structure:
Wave I started the diagonal formation, initiating the rising trend.
Waves II and IV acted as corrections, forming higher lows.
Wave V extended slightly but failed to make a strong breakout, suggesting exhaustion.
The price currently trades near 0.6560, with a potential retracement zone between 0.6450 and 0.6500. This range coincides with a strong demand zone and the lower boundary of the diagonal pattern. A pullback into this area could complete the corrective (A)-(B)-(C) structure before the next major directional move.
Key Levels
Support Zone: 0.6450 – 0.6500
Immediate Resistance: 0.6650 – 0.6680
Breakout Confirmation: A sustained break below 0.6450 could confirm the end of the diagonal and open the door toward 0.63 in the medium term.
Invalidation: A breakout above 0.67 would invalidate the bearish correction scenario.
Market Outlook
The diagonal’s completion suggests that the pair may enter a short-term correction phase. However, traders should monitor price action near the support area before confirming the next trend direction. If buyers defend the 0.6450 zone, a rebound toward 0.6650 is likely. Conversely, a clear break below the wedge would strengthen bearish momentum.
Given the overall wave count, the market is likely in transition between an impulsive and a corrective phase. Patience is crucial at this stage, as the next few sessions will determine whether the larger uptrend resumes or a deeper retracement unfolds.
Pullback TradeThe market is on bearish movement for many days now, and the price has rejected this area multiple times today, as we can see the market made a strong bearish move on the 4 hour Timeframe, suggesting that a bearish movement is at hand
WE ONLY TRADE PULLBACKS
comment your thoughts

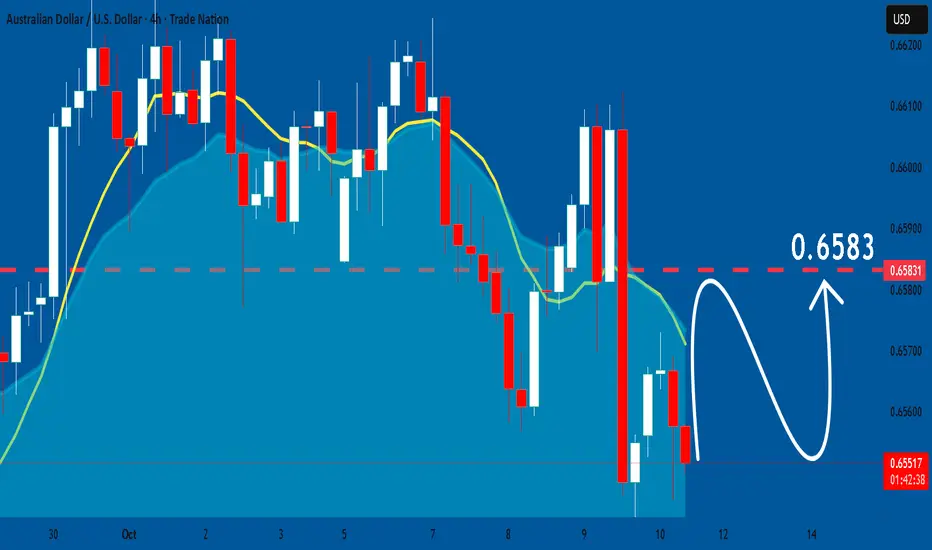
AUDUSD: Expecting Bullish Movement! Here is Why:
Looking at the chart of AUDUSD right now we are seeing some interesting price action on the lower timeframes. Thus a local move up seems to be quite likely.
Disclosure: I am part of Trade Nation's Influencer program and receive a monthly fee for using their TradingView charts in my analysis.
❤️ Please, support our work with like & comment! ❤️
AUDUSD H4 | Bearish Momentum DevelopingAUD/USD is rising towards the sell entry which is a pullback resistance andoculd reverse from this levl to the downside.
Sell entry is at 0.6590, whichis a pullback resistance.
Stop loss is at 0.6621, which is a multi swing high resistance.
Take profit is at 0.6521, which is an overlap support that is slightly above the 61.8% Fibonacci projection.
High Risk Investment Warning
Trading Forex/CFDs on margin carries a high level of risk and may not be suitable for all investors. Leverage can work against you.
Stratos Markets Limited (tradu.com ):
CFDs are complex instruments and come with a high risk of losing money rapidly due to leverage. 65% of retail investor accounts lose money when trading CFDs with this provider. You should consider whether you understand how CFDs work and whether you can afford to take the high risk of losing your money.
Stratos Europe Ltd (tradu.com ):
CFDs are complex instruments and come with a high risk of losing money rapidly due to leverage. 66% of retail investor accounts lose money when trading CFDs with this provider. You should consider whether you understand how CFDs work and whether you can afford to take the high risk of losing your money.
Stratos Global LLC (tradu.com ):
Losses can exceed deposits.
Please be advised that the information presented on TradingView is provided to Tradu (‘Company’, ‘we’) by a third-party provider (‘TFA Global Pte Ltd’). Please be reminded that you are solely responsible for the trading decisions on your account. There is a very high degree of risk involved in trading. Any information and/or content is intended entirely for research, educational and informational purposes only and does not constitute investment or consultation advice or investment strategy. The information is not tailored to the investment needs of any specific person and therefore does not involve a consideration of any of the investment objectives, financial situation or needs of any viewer that may receive it. Kindly also note that past performance is not a reliable indicator of future results. Actual results may differ materially from those anticipated in forward-looking or past performance statements. We assume no liability as to the accuracy or completeness of any of the information and/or content provided herein and the Company cannot be held responsible for any omission, mistake nor for any loss or damage including without limitation to any loss of profit which may arise from reliance on any information supplied by TFA Global Pte Ltd.
The speaker(s) is neither an employee, agent nor representative of Tradu and is therefore acting independently. The opinions given are their own, constitute general market commentary, and do not constitute the opinion or advice of Tradu or any form of personal or investment advice. Tradu neither endorses nor guarantees offerings of third-party speakers, nor is Tradu responsible for the content, veracity or opinions of third-party speakers, presenters or participants.
