Sell AUDUSD SignalShorting AUDUSD to that support section, I spotted many reversals on the supply and demand zones drawn on this setup
Thanks
Don
USDAUD trade ideas

AUD H & S SELL IDEAAfter seeing AUD form a Head and shoulders pattern i am looking for the pair to break lows before returning back up retesting the Neckline and finally selling of to the higher time frame 50% FIB level

AUDUSDToday's news of the dollar caused a decline in this chart and I predict that we will have a slight rise, it is a risky transaction and if you want to take it, take it with a risk of less than 1%.

AUD/USD Made A Reversal Pattern ,H&S Will Change The Direction ?This Is An Educational + Analytic Content That Will Teach Why And How To Enter A Trade
Make Sure You Watch The Price Action Closely In Each Analysis As This Is A Very Important Part Of Our Method
Disclaimer : This Analysis Can Change At Anytime Without Notice And It Is Only For The Purpose Of Assisting Traders To Make Independent Investments Decisions.

Short position on the AUDUSD currency pairHi Guys
We see a good opportunity to short the AUDUSD currency pair.
We enter the transaction according to the chart and with capital management.
R/R: 2.75

Aussie H4 | Resistance overhead?The Aussie (AUD/USD) is rising towards a pullback resistance and could potentially reverse off this level to drop lower.
Sell entry is at 0.6689 which is a pullback resistance.
Stop loss is at 0.6724 which is a level that sits above a swing-high resistance.
Take profit is at 0.6601 which is a multi-swing-low support that lies above the 50.0% Fibonacci retracement level.
High Risk Investment Warning
Trading Forex/CFDs on margin carries a high level of risk and may not be suitable for all investors. Leverage can work against you.
Stratos Markets Limited (www.fxcm.com):
CFDs are complex instruments and come with a high risk of losing money rapidly due to leverage. 68% of retail investor accounts lose money when trading CFDs with this provider. You should consider whether you understand how CFDs work and whether you can afford to take the high risk of losing your money.
Stratos Europe Ltd, previously FXCM EU Ltd (www.fxcm.com):
CFDs are complex instruments and come with a high risk of losing money rapidly due to leverage. 70% of retail investor accounts lose money when trading CFDs with this provider. You should consider whether you understand how CFDs work and whether you can afford to take the high risk of losing your money.
Stratos Trading Pty. Limited (www.fxcm.com):
Trading FX/CFDs carries significant risks. FXCM AU (AFSL 309763), please read the Financial Services Guide, Product Disclosure Statement, Target Market Determination and Terms of Business at www.fxcm.com
Stratos Global LLC (www.fxcm.com):
Losses can exceed deposits.
Please be advised that the information presented on TradingView is provided to FXCM (‘Company’, ‘we’) by a third-party provider (‘TFA Global Pte Ltd’). Please be reminded that you are solely responsible for the trading decisions on your account. There is a very high degree of risk involved in trading. Any information and/or content is intended entirely for research, educational and informational purposes only and does not constitute investment or consultation advice or investment strategy. The information is not tailored to the investment needs of any specific person and therefore does not involve a consideration of any of the investment objectives, financial situation or needs of any viewer that may receive it. Kindly also note that past performance is not a reliable indicator of future results. Actual results may differ materially from those anticipated in forward-looking or past performance statements. We assume no liability as to the accuracy or completeness of any of the information and/or content provided herein and the Company cannot be held responsible for any omission, mistake nor for any loss or damage including without limitation to any loss of profit which may arise from reliance on any information supplied by TFA Global Pte Ltd.
The speaker(s) is neither an employee, agent nor representative of FXCM and is therefore acting independently. The opinions given are their own, constitute general market commentary, and do not constitute the opinion or advice of FXCM or any form of personal or investment advice. FXCM neither endorses nor guarantees offerings of third-party speakers, nor is FXCM responsible for the content, veracity or opinions of third-party speakers, presenters or participants.

Market Analysis: AUD/USD Could Continue HigherMarket Analysis: AUD/USD Could Continue Higher
AUD/USD is correcting gains from the 0.6700 zone.
Important Takeaways for AUD USD Analysis Today
The Aussie Dollar started a downside correction from 0.6700 against the US Dollar.
There is a key bullish trend line forming with support at 0.6645 on the hourly chart of AUD/USD at FXOpen.
AUD/USD Technical Analysis
On the hourly chart of AUD/USD at FXOpen, the pair started a fresh increase from the 0.6590 support. The Aussie Dollar was able to clear the 0.6630 resistance to move into a positive zone against the US Dollar.
There was a close above the 0.6645 resistance and the 50-hour simple moving average. Finally, the pair tested the 0.6700 zone. A high was formed near 0.6698 and the pair is now correcting gains.
There was a move below the 0.6670 level. The pair declined below the 50% Fib retracement level of the upward move from the 0.6590 swing low to the 0.6698 high. On the downside, initial support is near a key bullish trend line at 0.6645.
The next major support is near the 61.8% Fib retracement level of the upward move from the 0.6590 swing low to the 0.6698 high at 0.6630.
If there is a downside break below the 0.6630 support, the pair could extend its decline toward the 0.6590 level. Any more losses might signal a move toward 0.6520.
On the upside, the AUD/USD chart indicates that the pair is now facing resistance near 0.6670. The first major resistance might be 0.6700. An upside break above the 0.6700 resistance might send the pair further higher.
The next major resistance is near the 0.6720 level. Any more gains could clear the path for a move toward the 0.6750 resistance zone.
Trade over 50 forex markets 24 hours a day with FXOpen. Take advantage of low commissions, deep liquidity, and spreads from 0.0 pips. Open your FXOpen account now or learn more about trading forex with FXOpen.
This article represents the opinion of the Companies operating under the FXOpen brand only. It is not to be construed as an offer, solicitation, or recommendation with respect to products and services provided by the Companies operating under the FXOpen brand, nor is it to be considered financial advice.

check the trend If the price changes in the current resistance range, the beginning of the downward trend will be likely.
If the price crosses the resistance range, it will be possible to continue the upward trend

AUDUSD: slight correction from the peak areaAUDUSD: The AUD in the short term has also had a slight correction from the peak of 0.6680. It is expected that in the short term, AUDUSD will fluctuate and accumulate with the support area around the 0.6600 threshold. In today's session, it is possible that AUD will test this price range again. Ace can consider waiting to buy up AUDUSD today.

AUDUSD Long - 4 confirmations Part 4. Cut Even Trade $100 profitDecided to exit out of the market after holding this trade for 12 hours. We protected our capital and took a cut even trade with $100 profit. The account is still up 2% for the week and 4% total for the last week and half. We have taken a total of 6 trades since last monday, 1 small loss, 2 cut evens and 3 wins.

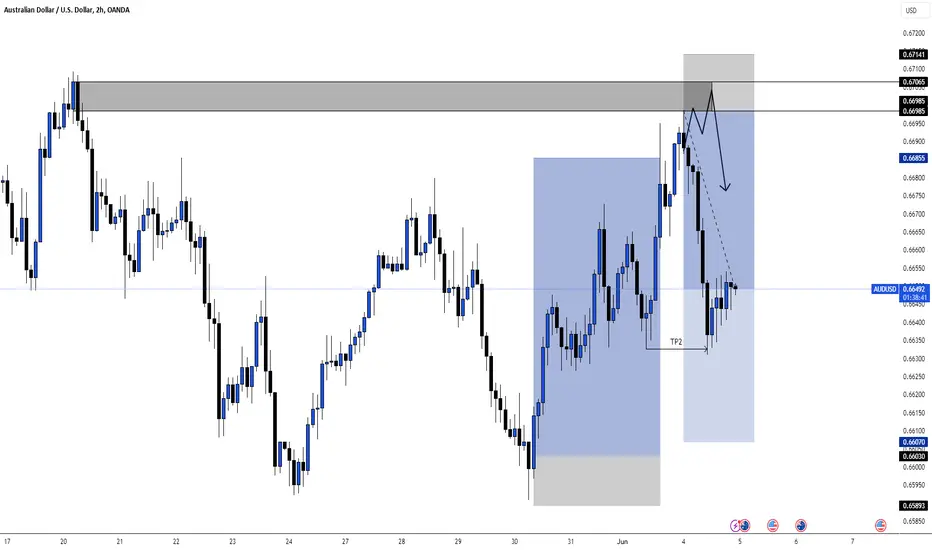
CHART BREAKDOWN AUDUSD: Key Levels, Targets and Thoughts!Trade Update: AUD/USD
We have some great news on our recent AUD/USD trade! 💲
After analyzing the market conditions and identifying a solid setup, our trade has successfully Hit Take Profit 2 (TP2). This made sure that 80% of our positions have been secured and cashed out some of our gains, allowing us to lock in profits and reduce risk.
Following this, we moved our stop loss to TP1 to ensure no loss on the remaining position. This strategy not only protects our capital but also gives us the opportunity to capture further potential gains with zero risk on the table and cashing out on TP3s.
Stay tuned for more updates and happy trading! 🚀
AUD/USD slides on weak Australian data, GDP nextThe Australian dollar continues to swing sharply this week. AUD/USD is trading at 0.6641 in the North American session, down 0.71% on the day. The downswing has wiped out the Aussie’s gains of 0.55% on Monday.
Australia posted weak data earlier today, which has weighed on the Australian dollar. Corporate profits declined 2.5% q/q in the first quarter after revised growth of 7.1% in the fourth quarter. This was well short of the market estimate of -0.9%. On an annualized basis, corporate profits plunged 8.6%, marking a fourth straight quarter of contraction.
Australia also posted a current account deficit of AUD 4.9 billion in the first quarter, after a revised surplus of AUD 2.7 billion in Q4 2023. This missed the market estimate of a surplus of AUD 5.9 billion. The trade surplus fell as imports rose and exports declined, as metal ore prices fell. Today’s silver lining was an improvement in retail sales, which rebounded with a small gain of 0.1% m/m in April, after a -0.4% reading in March
Australia’s GDP is expected to fall to 1.2% y/y in the fourth quarter, compared to 1.5% in the fourth quarter of 2023. GDP is expected to show weak growth of 0.2% q/q in the first quarter, unchanged from Q4 2023. Consumer spending has been soft as consumers grapple with high interest rates and stubborn inflation.
The March GDP data is expected to indicate that Australia narrowly avoided a recession. Normally, such an economic landscape would likely result in the Reserve Bank of Australia lowering rates in order to kick-start the limping economy. However, with inflation stickier than anticipated, the RBA is likely to wait before easing up on interest rates and hasn’t ruled out rate hikes in order to keep a lid on inflation. The RBA meets next on June 18th.
AUD/USD is testing support at 0.6641. Below, there is support at 0.6603
0.6692 and 0.6730 are the next resistance lines

audusd is bullishKey Points:
Australian private sector PMI numbers for May drew investor interest early in the Thursday (May 23) Asian session.
The Judo Bank Services PMI slipped from 53.6 to 53.1, while the Manufacturing PMI held steady at 49.6.
Later in the Thursday session, US jobless claims and the Services PMI also need consideration.
Near-term AUD/USD trends could hinge on the US Services PMI and Fed speakers. Hotter-than-expected US services sector activity could fuel investor bets on a September Fed rate hike and tilt monetary policy divergence toward the US dollar.

AUDUSDThis looks interesting, I'm looking for the above BDB as a potential sell zone with sl sitting at or slightly above the high. also monitor the zone below for price action. the entire movement will complete the WXY correction for more upside

AUDUSD buy at support 0.665 Yesterday was a very successful day of trading , every pair was profitable check minds and ideas.
I look to buy at 0.665 which is the average price range base on the 100ema
the daily chart shows bullish
we trade with the overall always
yesterday AUDUSD dominated USD and there is not stopping
SL 0.6615
TP 0.671
The pair failed to break 0.67 yesterday but when it does it will continue to boom.

AUDUSD AUSTRALIAN DOLLAR NEXT LONGHi again,
AUDUSD pair has solid long positions backing in recent data and institutional futures positions.
After data release now the long from here 0.663 AUDUSD might work, but I prefer to wait for better position. I will build longs and stop loss accordingly to the long position I shared on chart.

AUDUSD Long - 4 confirmations Part 3 Reduced SL to 0.5%AUDUSD Long - 4 confirmations Part 3 Reduced SL to 0.5%

AUDUSD Long - 4 confirmations Part 2 Reduced SL to 0.5%AUDUSD Long - 4 confirmations Part 2 Reduced SL to 0.5%. Protected our capital.

This morning, a short opportunity is emerging on AUMy algorithms and AI are telling me that a short opportunity is building up upon AU. Showing you in the chart what my first and second entries into this position would be. Good luck.

Long AUDUSDCurrently bullish on AUDUSD, I have 2 TP points in mind. I'm seeking liquidity above 0.67300 and 0.68800. We've swept the buy stop liquidity levels below 0.64500 and now I'm expecting price to target sell stop liquidity levels. Currently 40 pips in profit with a total profit take of 256, SL set to breakeven, risk free trade. Let's see how this plays out over the coming weeks. Good luck Traders, if you see something similar or different feel free to share!

AUDUSD Long - 4 Confirmations Part 1 R:R 1:2AUDUSD Long- decided upon four confirmations. These are the four confirmation that are required in order for us to enter the market in this set up
4 confirmations:
1st Confirmation: Retest at one of the designated fib levels. The fib levels need to be measured from the H4, H8 or Daily timeframe
2nd Confirmation: Retest at a zone of Supply and Demand. The Supply and Demand zone needs to be formed from the H4, H8 or Daily timeframe.
3rd Confirmation: Confirmed engulfing pattern in the direction of the trade starting at the H1.
4th Confirmation: Break of support or resistance in the lower timeframes starting with the 3 minute in the direction of the trade.

DeGRAM | AUDUSD breakout of the retracement levelAUDUSD is moving in an ascending channel between the trend lines.
The price is above the support coinciding with the 62% retracement level.
The chart has maintained an ascending structure.
We expect the growth to continue after the support is retested.
-------------------
Share your opinion in the comments and support the idea with like. Thanks for your support!

Aussie H4 | Falling to pullback supportThe Aussie (AUD/USD) is falling towards a pullback support and could potentially bounce off this level to climb higher.
Buy entry is at 0.6601 which is a pullback support that aligns with the 100.0% Fibonacci projection level.
Stop loss is at 0.6569 which is a level that lies underneath a pullback support and the 50.0% Fibonacci retracement level.
Take profit is at 0.6670 which is a pullback resistance.
High Risk Investment Warning
Trading Forex/CFDs on margin carries a high level of risk and may not be suitable for all investors. Leverage can work against you.
Stratos Markets Limited (www.fxcm.com):
CFDs are complex instruments and come with a high risk of losing money rapidly due to leverage. 68% of retail investor accounts lose money when trading CFDs with this provider. You should consider whether you understand how CFDs work and whether you can afford to take the high risk of losing your money.
Stratos Europe Ltd, previously FXCM EU Ltd (www.fxcm.com):
CFDs are complex instruments and come with a high risk of losing money rapidly due to leverage. 70% of retail investor accounts lose money when trading CFDs with this provider. You should consider whether you understand how CFDs work and whether you can afford to take the high risk of losing your money.
Stratos Trading Pty. Limited (www.fxcm.com):
Trading FX/CFDs carries significant risks. FXCM AU (AFSL 309763), please read the Financial Services Guide, Product Disclosure Statement, Target Market Determination and Terms of Business at www.fxcm.com
Stratos Global LLC (www.fxcm.com):
Losses can exceed deposits.
Please be advised that the information presented on TradingView is provided to FXCM (‘Company’, ‘we’) by a third-party provider (‘TFA Global Pte Ltd’). Please be reminded that you are solely responsible for the trading decisions on your account. There is a very high degree of risk involved in trading. Any information and/or content is intended entirely for research, educational and informational purposes only and does not constitute investment or consultation advice or investment strategy. The information is not tailored to the investment needs of any specific person and therefore does not involve a consideration of any of the investment objectives, financial situation or needs of any viewer that may receive it. Kindly also note that past performance is not a reliable indicator of future results. Actual results may differ materially from those anticipated in forward-looking or past performance statements. We assume no liability as to the accuracy or completeness of any of the information and/or content provided herein and the Company cannot be held responsible for any omission, mistake nor for any loss or damage including without limitation to any loss of profit which may arise from reliance on any information supplied by TFA Global Pte Ltd.
The speaker(s) is neither an employee, agent nor representative of FXCM and is therefore acting independently. The opinions given are their own, constitute general market commentary, and do not constitute the opinion or advice of FXCM or any form of personal or investment advice. FXCM neither endorses nor guarantees offerings of third-party speakers, nor is FXCM responsible for the content, veracity or opinions of third-party speakers, presenters or participants.
