check the trend It is expected that the price will change the trend in the range of the support trend line and we will see the beginning of the upward trend.
If the price crosses the support trend line, it will be possible to continue the corrective trend up to the support range
USDAUD trade ideas

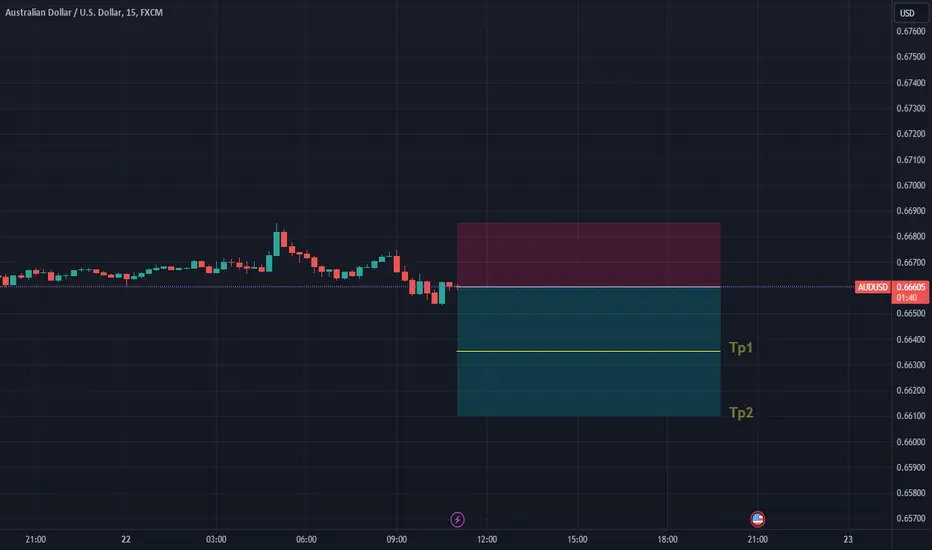
AUDUSD BEARISH -MAY 22📢 Signal: SELL AUDUSD 📉
Entry Point: 0.66603 🔍
TP1: 0.66353 🎯 (25 pip TP)
TP2: 0.66603 🎯 (50 pip TP)
SL: 0.66853 ⛔️ (25 pip SL)
Ensure proper risk management when following signals! 💡
@Mr_Bombastic_Signal
AUDUSD SELLSAUSSIE is rejecting buyside.
It has tried to break highs atleast 3times but failed.
We should probably start seeing sells from now

AUDUSD InsightHello to all our subscribers.
Please share your personal opinions in the comments. Also, don't forget to like and subscribe.
Although the dollar weakened with expectations of a rate cut following the April CPI announcement in the U.S., the current atmosphere is cooling down. It seems difficult to expect a sharp rise or fall until a new issue emerges. The FOMC meeting minutes will be released this week, and the U.S. April PCE inflation index will be announced next week. It's important to keep an eye on the results of these issues.
The UK's April consumer price index exceeded expectations at 2.3%.
The Federal Open Market Committee meeting minutes will be released on May 23rd.
The U.S. Q1 GDP (QoQ) will be announced on May 30th.
The Eurozone's May consumer price index and the U.S. April personal consumption expenditure price index will be announced on May 31st.
The AUDUSD is currently forming a price near the trend high. It seems that no catalyst has been found to break through the resistance of the high yet. If it breaks below the 0.66500 line, it is likely to establish a downward direction.
The current expectation is for a high resistance, with a pullback to the 0.63000 line, followed by a rebound to test the high resistance once more. Ultimately, we expect a medium to long-term decline to the 0.62000 line.
If the movement deviates from expectations, we will quickly adjust our strategy.

AUDUSD long 1:8 RRHello
I hope you've made money on the trades posted this week. I am looking at this trade for today into next week.
* Running flat (three corrective structure) formed
* ORDER BLOCK has been taken out
* MACD divergence
* Gap at 0.68176

AUDUSD Short Idea for: through to JuneThis for through to June is really for in other words anticipation of a US Dollar strengthening, with, as of now, divergent Drift; so what )), oh yeah, ...the circle for the length of the a month and a Fibonacci Channel going from start of month to end of month at Bullish Targets, i.e. Resistance, anchored at the start of the month also, at Support, i.e. price above which there are buyers, parallel ...
\\ The _circle remains in the same place on the price chart canvas, and so it being interpret-able as Target or Resistance when buying, is somewhat proportional to the screen display monitor resolution which is why there's three numbers at below the price and Drift, one red, one yellow, one green, never heard that before, and that's the Torque which determines, variably, the Height of an Ellipse, to threeangulate the circle's radius with Torque of price, which is basic average of Highs minus average of Lows

Aussie is going for the previous week high think we will see a buy-side in the first part of the week. Even up to 3 STDs as explained in the video. A pullback to the Breaker and FVG confluence is my poi for the entry.
Video analysis below
Always follow these rules
- Accumulation / Manipulation / Distribution
- No liquidity raid = No trade
- Never buy high and never sell low
“Adapt what is useful, reject what is useless, and add what is specifically your own.”
Dave FX Hunter ⚔

Falling towards 50% Fibonacci support?AUD/USD is falling towards a support level which is a pullback support that lines up with the 50% Fibonacci retracement and could bounce from this level to our take profit.
Entry: 0.6638
Why we like it:
There is a pullback support level which aligns with the 50% Fibonacci retracement.
Stop loss: 0.6593
Why we like it:
There is a pullback support level.
Take profit: 0.6712
Why we like it:
There is a pullback resistance level.

✅AUD_USD WILL GO UP|LONG🚀
✅AUD_USD is trading in an uptrend
With the pair set to retest
The rising support line
From where I think the growth will continue
LONG🚀
✅Like and subscribe to never miss a new idea!✅

Alikze »» AUDUSD | PullBack to the previous roofIn time 4H, it is moving in an ascending channel. According to the previous analysis, he made corrections up to the target range of the bottom of the channel.
💎 But now, after the failure of the resupply zone, it has been directed to the floor of the channel, which, if supported in the green box area (the previous ceiling), can continue to move up to the midline of the channel.
💎 Alternative scenario: If the range of the green box is broken, it can continue the modification until the next roof area (the second green box).
»»»«««»»»«««»»»«««
Please support this idea with a LIKE and COMMENT if you find it useful and Click "Follow" on our profile if you'd like these trade ideas delivered straight to your email in the future.
Thanks for your continued support.
Sincerely.❤️
»»»«««»»»«««»»»«««

AUDUSD: Pullback From Support 🇦🇺🇺🇸
AUDUSD looks bullish to me after a test of a key intraday structure support.
I see 2 strong bullish confirmations:
- double bottom formation and a breakout of its neckline
- falling channel and a breakout of its resistance.
I expect a bullish movement now at least to 0.669
❤️Please, support my work with like, thank you!❤️

AUDUSD BearishAUDUSD has formed the head and shoulders pattern indicating price action to downside. Taking position on possible trend reversal will be suitable.

AUDUSD - Bearish TradeWe will wait for the Breakout of Head & Shoulder at 0.66440.
Sellers will remain in control after the price crosses down the neckline support.
Before forming Head & Shoulder, we have observed Bearish Divergence.

Aud/USD insider informationThe information or advice provided does not take into account all of your goals, current financial situation or needs. Therefore, you should consider the appropriateness of the advice before taking any further action. Stocks, futures, options, spread betting, spread betting and CFD trading, and any other leveraged trading activity involves risk. You shouldn't trade with money you can't afford to lose. Be honest with yourself.
Thank you for browsing here. Good luck and lots of money. Just make sure you do it over a period of time and don't try to make millions of dollars in a week or a day.

AUDUSD BUYBase on Higher TF, the market is bullish. There's a break of the weekly structure and the market is currently in a correction phase.
We could probably see buyers showing interest at the current price range.
Let's see how this will play out.
Feel free to share your views.

Sell Idea AUD/USDWe can expect a downward reaction from the specified resistance range, but this trade is short-term and should be actively managed.

AUDUSDThe AUD/USD pair is poised for an upward move on the 4-hour timeframe as it follows an ascending channel pattern. After completing a 50% retracement, the price has broken through a resistance level, indicating strong bullish momentum. This technical setup suggests a continuation of the upward trend.

AUD/USD will strengthen as the Chinese economy improvesAUD/USD will strengthen as the Chinese economy improves
Examining the trend in the four-hour time frame, AUD/USD has an important support zone in the range of 0.6662-0.6646, and now, considering the rising averages of the ALIIGATOR indicator, there is a possibility of a price increase.
Overall, the scenario is strengthened that AUD/USD can rise to the resistance of the ceiling of the ascending channel at $0.6823, provided that the ascending channel bottom supports the range of 0.6662-0.6646.

Audusd LONG POSITION confirmation entryAs we shared yesterday. Price is currently respecting our demand zone and a perfect time to look for bullish entries.
Price took out External sellside liquidity, which was also the LOW OF WEEK.
Look for 15 min entry and target swing high.

AUDUSD: Structure Analysis - LONGAUDUSD: Structure Analysis - LONG
The price broke out from a strong structure zone rising in this way the chances for a bigger bullish move.
The economic calendar is empty for today and it can spend some time in correction before
the bullish move begins.
📺You may watch the video for further details📺
Thank you and Good Luck!
❤️PS: Please support with a like or comment if you find this analysis useful for your trading day❤️

AUD/USD Long Setup: Buying at 0.666Our last trades on this pair was a major success!!
We are strategically positioning to buy AUD/USD at 0.666. The medium-term outlook remains bullish, bolstered by a consistent pattern of higher highs and higher lows. Anticipating a minor pullback, we aim to establish long positions at this level, optimizing the risk/reward profile.
Our entry at 0.666 is substantiated by the 50% Fibonacci retracement level, further reinforced by the proximity of the 100 EMA at 0.6664, underscoring this area as a robust support zone. Our initial resistance target is set at 0.671, reflecting a calculated approach to capturing potential upward momentum

AUDUSD is in range on the (HTF) 1MAUDUSD is in range on the (HTF) 1M and the Next Level target is 0.68000
Lets take advantage of the rest movement, its a 150 pips movement

Aussie H4 | Potential bullish bounceThe Aussie (AUD/USD) is falling towards an overlap support and could potentially bounce off this level to climb higher.
Buy entry is at 0.6645 which is an overlap support.
Stop loss is at 0.6613 which is a level that lies underneath an overlap support and the 38.2% Fibonacci retracement level.
Take profit is at 0.6712 which is a pullback resistance.
High Risk Investment Warning
Trading Forex/CFDs on margin carries a high level of risk and may not be suitable for all investors. Leverage can work against you.
Stratos Markets Limited (www.fxcm.com):
CFDs are complex instruments and come with a high risk of losing money rapidly due to leverage. 68% of retail investor accounts lose money when trading CFDs with this provider. You should consider whether you understand how CFDs work and whether you can afford to take the high risk of losing your money.
Stratos Europe Ltd, previously FXCM EU Ltd (www.fxcm.com):
CFDs are complex instruments and come with a high risk of losing money rapidly due to leverage. 70% of retail investor accounts lose money when trading CFDs with this provider. You should consider whether you understand how CFDs work and whether you can afford to take the high risk of losing your money.
Stratos Trading Pty. Limited (www.fxcm.com):
Trading FX/CFDs carries significant risks. FXCM AU (AFSL 309763), please read the Financial Services Guide, Product Disclosure Statement, Target Market Determination and Terms of Business at www.fxcm.com
Stratos Global LLC (www.fxcm.com):
Losses can exceed deposits.
Please be advised that the information presented on TradingView is provided to FXCM (‘Company’, ‘we’) by a third-party provider (‘TFA Global Pte Ltd’). Please be reminded that you are solely responsible for the trading decisions on your account. There is a very high degree of risk involved in trading. Any information and/or content is intended entirely for research, educational and informational purposes only and does not constitute investment or consultation advice or investment strategy. The information is not tailored to the investment needs of any specific person and therefore does not involve a consideration of any of the investment objectives, financial situation or needs of any viewer that may receive it. Kindly also note that past performance is not a reliable indicator of future results. Actual results may differ materially from those anticipated in forward-looking or past performance statements. We assume no liability as to the accuracy or completeness of any of the information and/or content provided herein and the Company cannot be held responsible for any omission, mistake nor for any loss or damage including without limitation to any loss of profit which may arise from reliance on any information supplied by TFA Global Pte Ltd.
The speaker(s) is neither an employee, agent nor representative of FXCM and is therefore acting independently. The opinions given are their own, constitute general market commentary, and do not constitute the opinion or advice of FXCM or any form of personal or investment advice. FXCM neither endorses nor guarantees offerings of third-party speakers, nor is FXCM responsible for the content, veracity or opinions of third-party speakers, presenters or participants.
