AUDUSD Daily Forecast -Q4 | W40 | D3 | Y25|
📅 Q4 | W40 | D3 | Y25|
📊 AUDUSD Daily Forecast
🔍 Analysis Approach:
I’m applying Smart Money Concepts, focusing on:
Identifying Points of Interest on the Higher Time Frames (HTFs) 🕰️
Using those POIs to define a clear trading range 📐
Refining those zones on Lower Time Frames (LTFs) 🔎
Waiting for a Break of Structure (BoS) for confirmation ✅
This method allows me to stay precise, disciplined, and aligned with the market narrative, rather than chasing price.
💡 My Motto:
"Capital management, discipline, and consistency in your trading edge."
A positive risk-to-reward ratio, paired with a high win rate, is the backbone of any solid trading plan 📈🔐
⚠️ Losses?
They’re part of the mathematical game of trading 🎲
They don’t define you — they’re necessary, they happen, and we move forward 📊➡️
🙏 I appreciate you taking the time to review my Daily Forecast.
Stay sharp, stay consistent, and protect your capital
— FRNGT 🚀
FX:AUDUSD
Trade ideas

AUD/USD Inverse Head and ShoulderLooking at the 4H timeframe the Aussie is setting up a possible inverse head and shoulder pattern. The neckline would be around .6628. Watch for a break there to retest the highs.

AUDUSD Daily Forecast - Q4 | W40 | D1 | Y25|📅 Q4 | W40 | D1 | Y25|
📊 AUDUSD Daily Forecast
🔍 Analysis Approach:
I’m applying Smart Money Concepts, focusing on:
Identifying Points of Interest on the Higher Time Frames (HTFs) 🕰️
Using those POIs to define a clear trading range 📐
Refining those zones on Lower Time Frames (LTFs) 🔎
Waiting for a Break of Structure (BoS) for confirmation ✅
This method allows me to stay precise, disciplined, and aligned with the market narrative, rather than chasing price.
💡 My Motto:
"Capital management, discipline, and consistency in your trading edge."
A positive risk-to-reward ratio, paired with a high win rate, is the backbone of any solid trading plan 📈🔐
⚠️ Losses?
They’re part of the mathematical game of trading 🎲
They don’t define you — they’re necessary, they happen, and we move forward 📊➡️
🙏 I appreciate you taking the time to review my Daily Forecast.
Stay sharp, stay consistent, and protect your capital
— FRNGT 🚀
FX:AUDUSD

AUDUSD Will Explode! BUY!
My dear subscribers,
My technical analysis for AUDUSD is below:
The price is coiling around a solid key level - 0.6592
Bias - Bullish
Technical Indicators: Pivot Points High anticipates a potential price reversal.
Super trend shows a clear buy, giving a perfect indicators' convergence.
Goal - 0.6603
My Stop Loss - 0.6585
About Used Indicators:
By the very nature of the supertrend indicator, it offers firm support and resistance levels for traders to enter and exit trades. Additionally, it also provides signals for setting stop losses
Disclosure: I am part of Trade Nation's Influencer program and receive a monthly fee for using their TradingView charts in my analysis.
———————————
WISH YOU ALL LUCK

AUDUSD Technical & Order Flow AnalysisOur analysis is based on a multi-timeframe top-down approach and fundamental analysis.
Based on our assessment, the price is expected to return to the monthly level.
DISCLAIMER: This analysis may change at any time without notice and is solely intended to assist traders in making independent investment decisions. Please note that this is a prediction, and I have no obligation to act on it, nor should you.
Please support our analysis with a boost or comment!

AUD/USD could bounce from THIS support levelThe AUD/USD is one of my favourite long plays right now owing to a risk on rally, rallying metal prices, a more hawkish than expected RBA, and the US dollar being under pressure across the board.
Dip-buyers will need to step in around current levels near 0.6580 to maintain control. This level was support/resistance in the past, and my expectations are that it will likely hold as support.
Resistance is clear to see: at 0.6625. If this level gets cleared, then we could well see a continuation towards and above last month's high of 0.6707
By Fawad Razaqzada, market analyst with FOREX.com

AUDUSD BullishAfter exiting a correction, the first impulse (Wave 1) appears. I expect a retracement of at least 50% of the Fibonacci.

AUD/USD SENDS CLEAR BEARISH SIGNALS|SHORT
Hello, Friends!
AUD/USD pair is trading in a local downtrend which know by looking at the previous 1W candle which is red. On the 9H timeframe the pair is going up. The pair is overbought because the price is close to the upper band of the BB indicator. So we are looking to sell the pair with the upper BB line acting as resistance. The next target is 0.652 area.
Disclosure: I am part of Trade Nation's Influencer program and receive a monthly fee for using their TradingView charts in my analysis.
✅LIKE AND COMMENT MY IDEAS✅

AUDUSD Will Go Higher From Support! Buy!
Here is our detailed technical review for AUDUSD.
Time Frame: 4h
Current Trend: Bullish
Sentiment: Oversold (based on 7-period RSI)
Forecast: Bullish
The market is testing a major horizontal structure 0.661.
Taking into consideration the structure & trend analysis, I believe that the market will reach 0.666 level soon.
P.S
We determine oversold/overbought condition with RSI indicator.
When it drops below 30 - the market is considered to be oversold.
When it bounces above 70 - the market is considered to be overbought.
Like and subscribe and comment my ideas if you enjoy them!

AUD/USD: Bullish Momentum Builds Within Ascending TriangleAUD/USD has rebounded sharply from the 0.6523 support zone, forming a bottom structure and reclaiming its position above the upward trendline. Price is now consolidating within an ascending triangle near 0.6620, indicating growing bullish pressure.
A break above the 0.6630 resistance would confirm a continuation to higher levels, with momentum favoring buyers. As long as 0.6600 holds as support, the bullish outlook remains intact.


Lingrid | AUDUSD Compression Phase Expansion ExpectedFX:AUDUSD has rebounded strongly from the 0.6523 support zone, forming a bottom and reclaiming the upward trendline. Price action is now consolidating inside an ascending triangle near 0.6620, signaling building bullish pressure. A sustained move above 0.6630 resistance would confirm continuation toward higher levels. Momentum remains favorable as long as 0.6600 holds as support.
⚠️ Risks:
Failure to hold 0.6600 could lead to a retest of the 0.6523 support area.
Breakdown of the ascending triangle may shift bias back to bearish.
Macro-driven USD strength could cap upside momentum despite the local structure.
If this idea resonates with you or you have your own opinion, traders, hit the comments. I’m excited to read your thoughts!

tend is your friend!making the trend lines for the forex thing
Going with the trend up and down up an ddown up and down

AUDUSD Daily Forecast - Q4 | W40 | D2 | Y25|📅 Q4 | W40 | D2 | Y25|
📊 AUDUSD Daily Forecast
🔍 Analysis Approach:
I’m applying Smart Money Concepts, focusing on:
Identifying Points of Interest on the Higher Time Frames (HTFs) 🕰️
Using those POIs to define a clear trading range 📐
Refining those zones on Lower Time Frames (LTFs) 🔎
Waiting for a Break of Structure (BoS) for confirmation ✅
This method allows me to stay precise, disciplined, and aligned with the market narrative, rather than chasing price.
💡 My Motto:
"Capital management, discipline, and consistency in your trading edge."
A positive risk-to-reward ratio, paired with a high win rate, is the backbone of any solid trading plan 📈🔐
⚠️ Losses?
They’re part of the mathematical game of trading 🎲
They don’t define you — they’re necessary, they happen, and we move forward 📊➡️
🙏 I appreciate you taking the time to review my Daily Forecast.
Stay sharp, stay consistent, and protect your capital
— FRNGT 🚀
FX:AUDUSD

02.10.25 Morning ForecastPairs on Watch -
FX:EURUSD
FX:NZDUSD
FX:AUDUSD
A short overview of the instruments I am looking at for today, multi-timeframe analysis down to what I will be looking at for an entry. Enjoy!

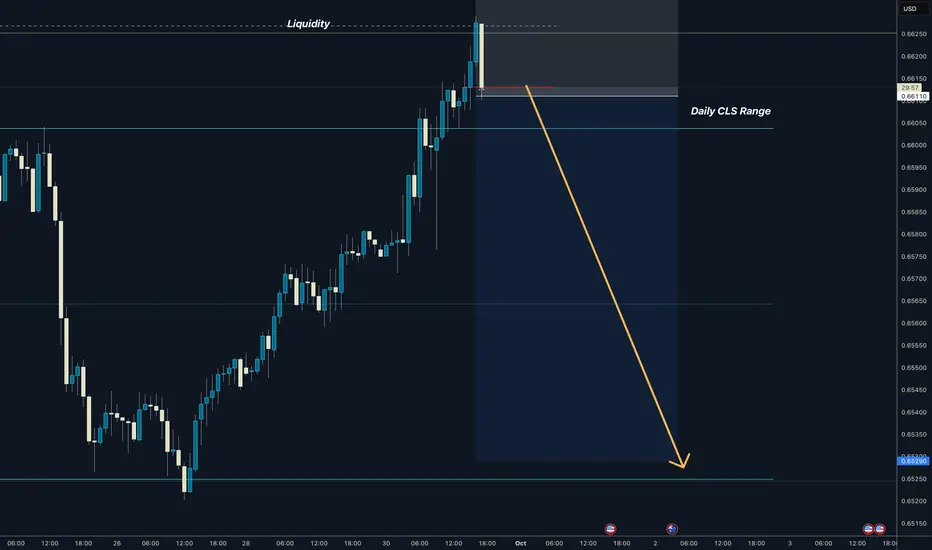
AUDUSD I Daily CLS range I Manipulation I ShortDaily CLS range manipulated.
Change in order flow created
I see it going down here - Trading model 1
Bigger picture
DXY is bullish now.
Good Luck
David Perk aka Dave Fx Hunter
AUDUSD Double Top at KEY RESISTANCE LEVELPrice retested major resistance level tested more than twice at (0.66286-0.66200) and got rejected at the level forming Double Top followed by new lower high, Break of Short term Trendline in (H1) triggering entry.

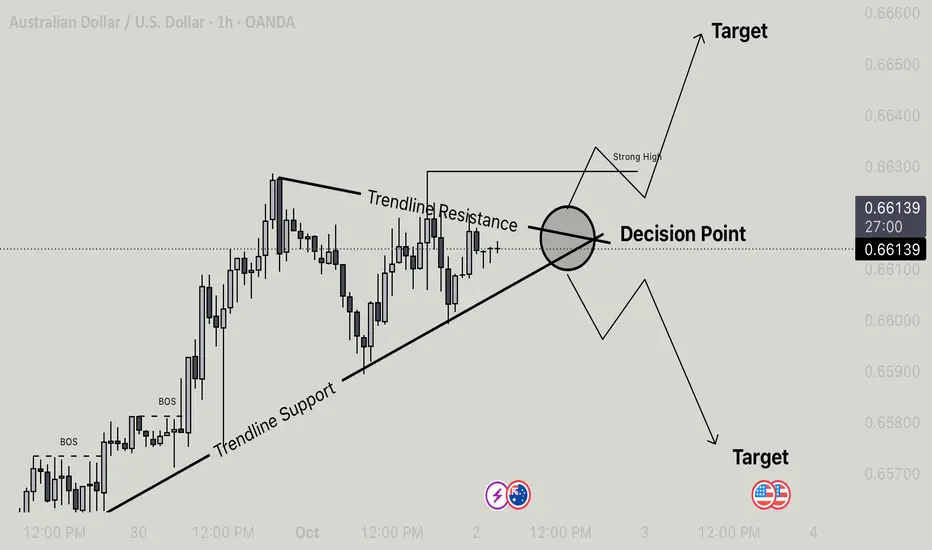
Aud/Usd - Make or Break ZonePrice is currently consolidating above trendline support and nearing a confluence zone of trendline resistance and a major Decision Point. Structure remains bullish after multiple BOS (Break of Structure), but momentum is slowing.
Two scenarios in play:
Bullish Case: A breakout above the descending trendline and Decision Point could lead to a push toward the Strong High and higher targets.
Bearish Case: A rejection from this zone may trigger a liquidity grab, targeting the lower Order Block zone around 0.79300, just above a strong low.
Waiting for clear reaction and price action confirmation at the Decision Point before taking a position. Patience is key.
AUDUSD Pullback Toward 0.65300 Within Ongoing UptrendHey Traders, in today's trading session we are monitoring AUDUSD for a buying opportunity around the 0.65300 zone. The pair is trading in an uptrend, with price currently correcting toward this key support/resistance level.
Structure: The broader bias remains bullish, but price is retracing after recent highs.
Key level in focus: 0.65300 — an area where buyers may look to step in and resume the upward move.
Fundamentals: Commodity-linked currencies remain supported by risk-on sentiment and a softer USD backdrop, which could help AUDUSD hold its bullish structure.
Trade safe,
Joe.

AUDUSD ENTRY IDEAOn this Pair, we are still BULLISH, as the DXY trend for the Intra-day trader is now BEARISH, also we have AUDUSD still in a bullish trend, also we have our structure intact with LTF entry pattern with the EMA confluence on the 15mins TF. If this idea matches with your idea, you can join us with a proper risk. Update will be shared in the Update session. THANK YOU.

AUDUSDAUDUSD
- Demand Zone
- Order Block
- Bearish Channel as an corrective pattern in Short Time Frame
- RSI - Divergence
- Completed " 12345 " Impulsive Waves and " ABC " Corrective Waves

AUDUSD H4 | Bullish ReversalAUD/USD is falling towards the buy entry, which is a pullback support that lines up with the 38.2% Fibonacci retracement and could bounce from this level to the upside.
Buy entry is at 0.6581, which is a pullback support that lines up with the 38.2% Fibonacci retracement.
Stop loss is at 0.6551, which is a pullback support that is slightly above the 78.6% Fibonacci retracement.
Take profit is at 0.6665, which is a pullback resistance.
High Risk Investment Warning
Trading Forex/CFDs on margin carries a high level of risk and may not be suitable for all investors. Leverage can work against you.
Stratos Markets Limited (tradu.com ):
CFDs are complex instruments and come with a high risk of losing money rapidly due to leverage. 65% of retail investor accounts lose money when trading CFDs with this provider. You should consider whether you understand how CFDs work and whether you can afford to take the high risk of losing your money.
Stratos Europe Ltd (tradu.com ):
CFDs are complex instruments and come with a high risk of losing money rapidly due to leverage. 66% of retail investor accounts lose money when trading CFDs with this provider. You should consider whether you understand how CFDs work and whether you can afford to take the high risk of losing your money.
Stratos Global LLC (tradu.com ):
Losses can exceed deposits.
Please be advised that the information presented on TradingView is provided to Tradu (‘Company’, ‘we’) by a third-party provider (‘TFA Global Pte Ltd’). Please be reminded that you are solely responsible for the trading decisions on your account. There is a very high degree of risk involved in trading. Any information and/or content is intended entirely for research, educational and informational purposes only and does not constitute investment or consultation advice or investment strategy. The information is not tailored to the investment needs of any specific person and therefore does not involve a consideration of any of the investment objectives, financial situation or needs of any viewer that may receive it. Kindly also note that past performance is not a reliable indicator of future results. Actual results may differ materially from those anticipated in forward-looking or past performance statements. We assume no liability as to the accuracy or completeness of any of the information and/or content provided herein and the Company cannot be held responsible for any omission, mistake nor for any loss or damage including without limitation to any loss of profit which may arise from reliance on any information supplied by TFA Global Pte Ltd.
The speaker(s) is neither an employee, agent nor representative of Tradu and is therefore acting independently. The opinions given are their own, constitute general market commentary, and do not constitute the opinion or advice of Tradu or any form of personal or investment advice. Tradu neither endorses nor guarantees offerings of third-party speakers, nor is Tradu responsible for the content, veracity or opinions of third-party speakers, presenters or participants.

