AUDUSD Trading Opportunity! BUY!
My dear friends,
My technical analysis for AUDUSD is below:
The market is trading on 0.6663 pivot level.
Bias - Bullish
Technical Indicators: Both Super Trend & Pivot HL indicate a highly probable Bullish continuation.
Target - 0.6672
Recommended Stop Loss - 0.6658
About Used Indicators:
A pivot point is a technical analysis indicator, or calculations, used to determine the overall trend of the market over different time frames.
Disclosure: I am part of Trade Nation's Influencer program and receive a monthly fee for using their TradingView charts in my analysis.
———————————
WISH YOU ALL LUCK
Trade ideas

AUDUSD H4 | Bearish reversal setupThe Aussie (AUD/USD) is reacting off the sell entry which is a pullback resistance and could reverse from this level to the downside.
Sell entry is at 0.6689, which is a pullback resistance.
Stop loss is at 0.6742, which is an overlap resistance.
Take profit is at 0.6620, whichis a pullback support that lines up with the 38.2% Fibonacci retracement.
High Risk Investment Warning
Trading Forex/CFDs on margin carries a high level of risk and may not be suitable for all investors. Leverage can work against you.
Stratos Markets Limited (tradu.com ):
CFDs are complex instruments and come with a high risk of losing money rapidly due to leverage. 65% of retail investor accounts lose money when trading CFDs with this provider. You should consider whether you understand how CFDs work and whether you can afford to take the high risk of losing your money.
Stratos Europe Ltd (tradu.com ):
CFDs are complex instruments and come with a high risk of losing money rapidly due to leverage. 66% of retail investor accounts lose money when trading CFDs with this provider. You should consider whether you understand how CFDs work and whether you can afford to take the high risk of losing your money.
Stratos Global LLC (tradu.com ):
Losses can exceed deposits.
Please be advised that the information presented on TradingView is provided to Tradu (‘Company’, ‘we’) by a third-party provider (‘TFA Global Pte Ltd’). Please be reminded that you are solely responsible for the trading decisions on your account. There is a very high degree of risk involved in trading. Any information and/or content is intended entirely for research, educational and informational purposes only and does not constitute investment or consultation advice or investment strategy. The information is not tailored to the investment needs of any specific person and therefore does not involve a consideration of any of the investment objectives, financial situation or needs of any viewer that may receive it. Kindly also note that past performance is not a reliable indicator of future results. Actual results may differ materially from those anticipated in forward-looking or past performance statements. We assume no liability as to the accuracy or completeness of any of the information and/or content provided herein and the Company cannot be held responsible for any omission, mistake nor for any loss or damage including without limitation to any loss of profit which may arise from reliance on any information supplied by TFA Global Pte Ltd.
The speaker(s) is neither an employee, agent nor representative of Tradu and is therefore acting independently. The opinions given are their own, constitute general market commentary, and do not constitute the opinion or advice of Tradu or any form of personal or investment advice. Tradu neither endorses nor guarantees offerings of third-party speakers, nor is Tradu responsible for the content, veracity or opinions of third-party speakers, presenters or participants.

AUDUSD InsightHello to all subscribers.
Please share your personal opinions in the comments. Don’t forget to boost and subscribe.
Key Points
- José Luis Escrivá, Governor of the Bank of Spain, said regarding Eurozone inflation: “There is still a lot of uncertainty. The scenario we considered most likely is unfolding, but that does not mean unexpected situations will not arise,” signaling a hawkish view.
- Steven Myron, a member of the White House Council of Economic Advisers, has been appointed as a Federal Reserve Board Governor and will attend this FOMC meeting. The market is balancing concerns over the Fed’s independence with expectations of rate cuts.
- Markets are focused on whether the Fed’s dot plot will signal just two rate cuts this year or increase to three cuts.
Major Economic Events This Week
+ September 17: Eurozone August CPI, Bank of Canada rate decision, FOMC results
+ September 18: Bank of England rate decision
+ September 19: Bank of Japan rate decision
AUDUSD Chart Analysis
After breaking above the 0.66000 level, the pair climbed to 0.67000. While there was a possibility of a short-term pullback in this zone, the current trend suggests the uptrend is likely to continue. The most probable target for the next high is around the 0.69000 level.

AUDUSD Gains Momentum Ahead of Fed DecisionDollar has been weakening, in particular since August 22nd when Powell spoke at Jackson Hole, acknowledged rising inflation risks, and more importantly, weakening labor data. Back then he signaled that the Fed could adjust rates with a 25 or possibly even a 50 basis point cut this Wednesday.
Looking at FX pairs, what stands out to me is that we are clearly in risk-on mode, with commodity currencies doing very well since late August. Aussie is up almost 4% from the August 22nd lows, while other majors are lagging behind that performance. So it may not be a bad idea to focus on Aussie for potential longs versus the US dollar, especially considering inflation in Australia increased on a yearly basis from 1.9% in June to 2.8% in July, as reported on August 27th. This shows inflation is still a problem in Australia, so the RBA may not be looking to cut rates, which makes AUDUSD attractive on the upside.
From an Elliott Wave perspective, I also like the impulsive characteristics on Aussie from the August 22nd close. In my view, we are still in an incomplete five-wave cycle, with the recent push beyond the July highs being wave three. After the next pullback in wave four, there could be a strong rebound, with the 0.6625 level standing out as attractive support on dips. I’ll certainly keep a close eye on this zone if a retracement occurs.
It’s also worth noting that Aussie is now trying to break the trendline from the 2021 highs, which could be an interesting breakout point and support the recovery, at least until the five-wave cycle completes on the 8-hour chart.
Grega

Long trade
Pair: AUDUSDT
Direction: Buyside Trade
Date: Tuesday, 16th September 2025
Time: 8:30 AM
Session: New York Session AM
Entry Timeframe: 15 sec TF
Narrative & Rationale
Buyside entry aligned with NY session volatility window (8:30 AM economic release hour).
Execution on the 15-second timeframe highlights precise order flow and liquidity capture.
15sec TF

AUD: (AUDUSD) Bullish Continuation..?Hello traders in this weekly view AUD remains in long position, it have been up trending for couple weeks now and in respect to this structure the pair is heading towards the resistance area as we can see which there might be a partial breakout above the resistance with a target at 0.7169 as the next resistance.
Meanwhile we anticipate a reversal below with a target at 0.6348 as the next partial support.
Possible Outline;
Hold on bullish position for long term trade and keep close eye on the resistance zone
Follow up
Thanks for reading

AUDUSD Daily Forecast -Q3 | W38 | D16 | Y25|📅 Q3 | W38 | D16 | Y25|
📊 AUDUSD Daily Forecast
🔍 Analysis Approach:
I’m applying Smart Money Concepts, focusing on:
Identifying Points of Interest on the Higher Time Frames (HTFs) 🕰️
Using those POIs to define a clear trading range 📐
Refining those zones on Lower Time Frames (LTFs) 🔎
Waiting for a Break of Structure (BoS) for confirmation ✅
This method allows me to stay precise, disciplined, and aligned with the market narrative, rather than chasing price.
💡 My Motto:
"Capital management, discipline, and consistency in your trading edge."
A positive risk-to-reward ratio, paired with a high win rate, is the backbone of any solid trading plan 📈🔐
⚠️ Losses?
They’re part of the mathematical game of trading 🎲
They don’t define you — they’re necessary, they happen, and we move forward 📊➡️
🙏 I appreciate you taking the time to review my Daily Forecast.
Stay sharp, stay consistent, and protect your capital
— FRNGT 🚀
FX:AUDUSD

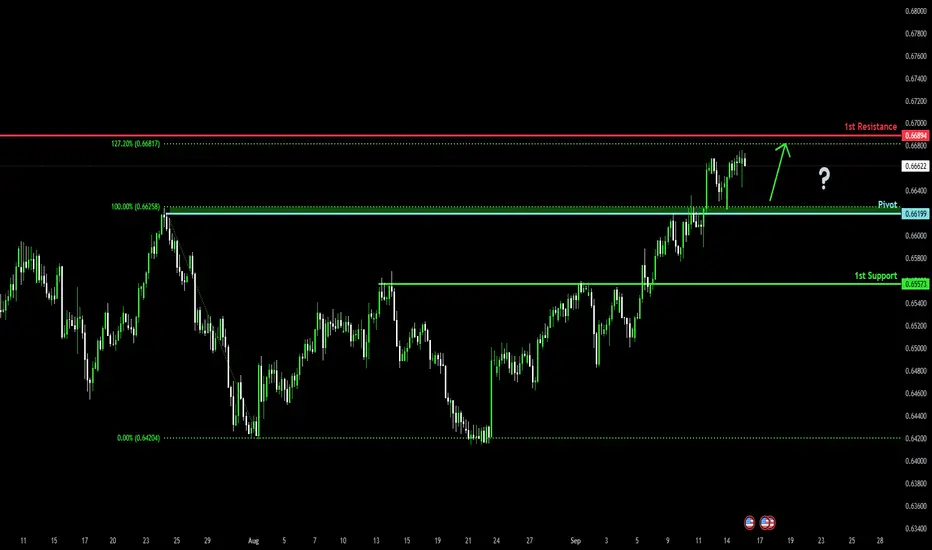
Bullish continuation?The Aussie (AUD/USD) has bounced off the pivot, which acts as a pullback support and could rise to the 1st resistance which aligns with the 127.2% Fibonacci extension.
Pivot: 0.6619
1st Support: 0.6557
1st Resistance: 0.6689
Oil markets on September 16, 2025, are caught between conflicting forces. While immediate supply disruption risks from Ukrainian attacks on Russian infrastructure and anticipated Federal Reserve rate cuts are providing near-term price support, fundamental market conditions point to significant oversupply ahead. The EIA's projection of massive inventory builds and OPEC+'s continued production increases suggest substantial downward price pressure through 2026, with Brent potentially falling to $50 per barrel despite current geopolitical tensions. The market is essentially pricing in short-term disruption risks while bracing for longer-term oversupply challenges.
AUDUSD — Trend intact → buy pullbacksChronex | AUDUSD - Bullish - Conviction - Med | Trend intact → buy pullbacks
Everything is align keep it pushing up
Structure is Bullish
Orderflow is bullish
Market Structure is bullish
Market Phase on expansion
Invalidation on chart
Target ERL

15-09-2025 AUDUSDAs shown in the figure:30M Bearish Butterfly
The market is not always chaotic and disorderly, and there is a precise geometric beauty hidden in price fluctuations. The harmonic form long strategy is a powerful tool for accurately identifying potential market reversal points based on the Fibonacci ratio. When the form forms perfectly at the key support level, it often indicates the depletion of bearish momentum and the initiation of bullish trends.

AUDUSD Confluence of trendlinesI wonder if anyone has noticed the confluence of trendlines in AUDUSD. There could be a powerful breakout to 0.7 level or a fakeout. I really don't know except time to be nimble and cautious

Forex pricing depending on TikTok Trade talks between the US and China are occurring this week, and a major topic of conversation could be how TikTok can be severed from its Chinese government and Chinese/ Hong Kong corporate interests.
How this plays out is could affect overall market sentiment in the U.S.–China trade relationship, which in turn could ripple through global risk assets. Forex pairs related to commodity exports or closely correlated with Chinese economic performance, like the Australian dollar (AUD), may see indirect effects.
AUD/USD is currently in an uptrend in the short‐term, trading within an ascending channel.
The latest candles show strong green closes with shallow pullbacks. That type of price action can indicates continuation rather than exhaustion, at least until the next key resistance zone.
Key resistance potentially lies at ~0.6687, with a more significant barrier at ~0.67485.
Support zones perhaps lie just below current prices: near the 9-day EMA. The 50-day EMA could provide a stronger support if the pair pulls back.

Uptrend It is expected that after some volatility, the upward trend will continue and the price will break through the resistance area. Then it can advance to the level of 161.8%.


AUDUSD uptrend continuation supported at 0.6610The AUDUSD remains in a bullish trend, with recent price action showing signs of a breakout within the broader uptrend.
Support Zone: 0.6610 – a key level from previous consolidation. Price is currently testing or approaching this level.
A bullish rebound from 0.6610 would confirm ongoing upside momentum, with potential targets at:
0.6695 – initial resistance
0.6720 – psychological and structural level
0.6740 – extended resistance on the longer-term chart
Bearish Scenario:
A confirmed break and daily close below 0.6610 would weaken the bullish outlook and suggest deeper downside risk toward:
0.6600 – minor support
0.6570 – stronger support and potential demand zone
Outlook:
Bullish bias remains intact while the AUDUSD holds above 0.6610. A sustained break below this level could shift momentum to the downside in the short term.
This communication is for informational purposes only and should not be viewed as any form of recommendation as to a particular course of action or as investment advice. It is not intended as an offer or solicitation for the purchase or sale of any financial instrument or as an official confirmation of any transaction. Opinions, estimates and assumptions expressed herein are made as of the date of this communication and are subject to change without notice. This communication has been prepared based upon information, including market prices, data and other information, believed to be reliable; however, Trade Nation does not warrant its completeness or accuracy. All market prices and market data contained in or attached to this communication are indicative and subject to change without notice.

AUDUSD possible bullish continuation for 0.6720price trading above previous trendline resistance level i.e. 0.6625. wait for pullback to test demand zone for low risk & high reward trade setup. buy limit order at 0.6592, stop loss: 0.6570, target: 0.6720

AUDUSD Daily Forecast- Q3 | W38 | D15 | Y25| 📅 Q3 | W38 | D15 | Y25|
📊 AUDUSD Daily Forecast
🔍 Analysis Approach:
I’m applying Smart Money Concepts, focusing on:
Identifying Points of Interest on the Higher Time Frames (HTFs) 🕰️
Using those POIs to define a clear trading range 📐
Refining those zones on Lower Time Frames (LTFs) 🔎
Waiting for a Break of Structure (BoS) for confirmation ✅
This method allows me to stay precise, disciplined, and aligned with the market narrative, rather than chasing price.
💡 My Motto:
"Capital management, discipline, and consistency in your trading edge."
A positive risk-to-reward ratio, paired with a high win rate, is the backbone of any solid trading plan 📈🔐
⚠️ Losses?
They’re part of the mathematical game of trading 🎲
They don’t define you — they’re necessary, they happen, and we move forward 📊➡️
🙏 I appreciate you taking the time to review my Daily Forecast.
Stay sharp, stay consistent, and protect your capital
— FRNGT 🚀
FX:AUDUSD

aud/usd shows break outIt seems the pair is making a breakout, it is approaching the weekly resistance, i assume it will become bearish soon as it has rejected the higher resistance already

AUDUSD | Potential bullish continuation setupThe Aussie (AUD/USD) is falling towards the buy entry which is a pullback support that aligns with the 23.6% Fibonacci retracement and could bounce from this level to the take profit.
Selle ntry id at 0.6620, which is a pullback support that aligns with the 23.6% Fibonacci retracement.
Stop loss is at 0.6568, which is a pullback support that is slightly below the 50% Fibonacci retracement.
Take profit is at 0.6703, which is a pullback resistance.
High Risk Investment Warning
Trading Forex/CFDs on margin carries a high level of risk and may not be suitable for all investors. Leverage can work against you.
Stratos Markets Limited (tradu.com ):
CFDs are complex instruments and come with a high risk of losing money rapidly due to leverage. 65% of retail investor accounts lose money when trading CFDs with this provider. You should consider whether you understand how CFDs work and whether you can afford to take the high risk of losing your money.
Stratos Europe Ltd (tradu.com ):
CFDs are complex instruments and come with a high risk of losing money rapidly due to leverage. 66% of retail investor accounts lose money when trading CFDs with this provider. You should consider whether you understand how CFDs work and whether you can afford to take the high risk of losing your money.
Stratos Global LLC (tradu.com ):
Losses can exceed deposits.
Please be advised that the information presented on TradingView is provided to Tradu (‘Company’, ‘we’) by a third-party provider (‘TFA Global Pte Ltd’). Please be reminded that you are solely responsible for the trading decisions on your account. There is a very high degree of risk involved in trading. Any information and/or content is intended entirely for research, educational and informational purposes only and does not constitute investment or consultation advice or investment strategy. The information is not tailored to the investment needs of any specific person and therefore does not involve a consideration of any of the investment objectives, financial situation or needs of any viewer that may receive it. Kindly also note that past performance is not a reliable indicator of future results. Actual results may differ materially from those anticipated in forward-looking or past performance statements. We assume no liability as to the accuracy or completeness of any of the information and/or content provided herein and the Company cannot be held responsible for any omission, mistake nor for any loss or damage including without limitation to any loss of profit which may arise from reliance on any information supplied by TFA Global Pte Ltd.
The speaker(s) is neither an employee, agent nor representative of Tradu and is therefore acting independently. The opinions given are their own, constitute general market commentary, and do not constitute the opinion or advice of Tradu or any form of personal or investment advice. Tradu neither endorses nor guarantees offerings of third-party speakers, nor is Tradu responsible for the content, veracity or opinions of third-party speakers, presenters or participants.

Potential bearish reversal for the Aussie?The price is reacting off the pivot and could reverse to the 1st support which acts as an overlap support.
Pivot: 0.6644
1st Support: 0.6452
1st Resistance: 0.6819
Disclaimer:
The above opinions given constitute general market commentary, and do not constitute the opinion or advice of IC Markets or any form of personal or investment advice.
Any opinions, news, research, analyses, prices, other information, or links to third-party sites contained on this website are provided on an "as-is" basis, are intended only to be informative, is not an advice nor a recommendation, nor research, or a record of our trading prices, or an offer of, or solicitation for a transaction in any financial instrument and thus should not be treated as such. The information provided does not involve any specific investment objectives, financial situation and needs of any specific person who may receive it. Please be aware, that past performance is not a reliable indicator of future performance and/or results. Past Performance or Forward-looking scenarios based upon the reasonable beliefs of the third-party provider are not a guarantee of future performance. Actual results may differ materially from those anticipated in forward-looking or past performance statements. IC Markets makes no representation or warranty and assumes no liability as to the accuracy or completeness of the information provided, nor any loss arising from any investment based on a recommendation, forecast or any information supplied by any third-party.

AUD/USD UpdateNext move on the way, focus on proper risk management & stay disciplined. Wishing you successful trades..!
Key Reason:
1. Price give BMS.
2. Bullish momentum strong.
3. Price creates BB.
4. possible bullish move expected.
This is not a financial advise. Confirmation very important. Let's see how it will work.

AUDUSD TRADE SETUPWait for entry level and bullish momentum candle then take a trade for Buy otherwise skip this setup

Bullish continuation?AUD/USD is falling towards the support level, which is a pullback support that is slightly below the 23.6% Fibonacci retracement and could bounce from this level to our take profit.
Entry: 0.6619
Why we like it:
There is a pullback support that is slightly below the 23.6% Fibonacci retracement.
Stop loss: 0.6568
Why we like it:
There is a pullback support that aligns with the 61.8% Fibonacci retracement.
Take profit: 0.6690
Why we like it:
There is a pullback resistance.
Enjoying your TradingView experience? Review us!
Please be advised that the information presented on TradingView is provided to Vantage (‘Vantage Global Limited’, ‘we’) by a third-party provider (‘Everest Fortune Group’). Please be reminded that you are solely responsible for the trading decisions on your account. There is a very high degree of risk involved in trading. Any information and/or content is intended entirely for research, educational and informational purposes only and does not constitute investment or consultation advice or investment strategy. The information is not tailored to the investment needs of any specific person and therefore does not involve a consideration of any of the investment objectives, financial situation or needs of any viewer that may receive it. Kindly also note that past performance is not a reliable indicator of future results. Actual results may differ materially from those anticipated in forward-looking or past performance statements. We assume no liability as to the accuracy or completeness of any of the information and/or content provided herein and the Company cannot be held responsible for any omission, mistake nor for any loss or damage including without limitation to any loss of profit which may arise from reliance on any information supplied by Everest Fortune Group.
