AUDUSD Will Move Higher! Buy!
Here is our detailed technical review for AUDUSD.
Time Frame: 1D
Current Trend: Bullish
Sentiment: Oversold (based on 7-period RSI)
Forecast: Bullish
The market is testing a major horizontal structure 0.655.
Taking into consideration the structure & trend analysis, I believe that the market will reach 0.662 level soon.
P.S
Please, note that an oversold/overbought condition can last for a long time, and therefore being oversold/overbought doesn't mean a price rally will come soon, or at all.
Disclosure: I am part of Trade Nation's Influencer program and receive a monthly fee for using their TradingView charts in my analysis.
Like and subscribe and comment my ideas if you enjoy them!
Trade ideas

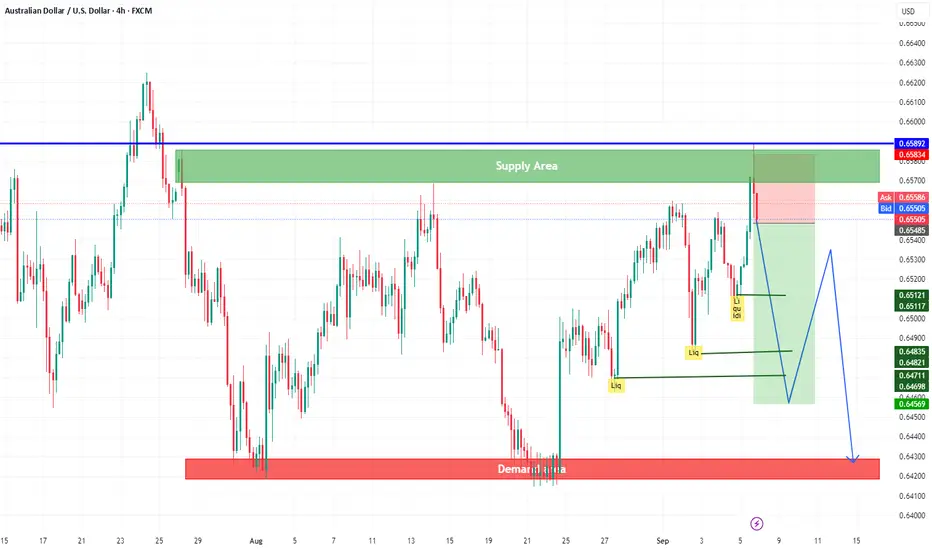
AUDUSD bearishWe have 3 liquidity areas, not sweep, and the price rebounds from the supply area to continue bearish and sweep the liquidity.
Q3 | W37 | D5 | Y25 AUDUSD ForecastQ3 | W37 | D5 | Y25 AUDUSD Forecast
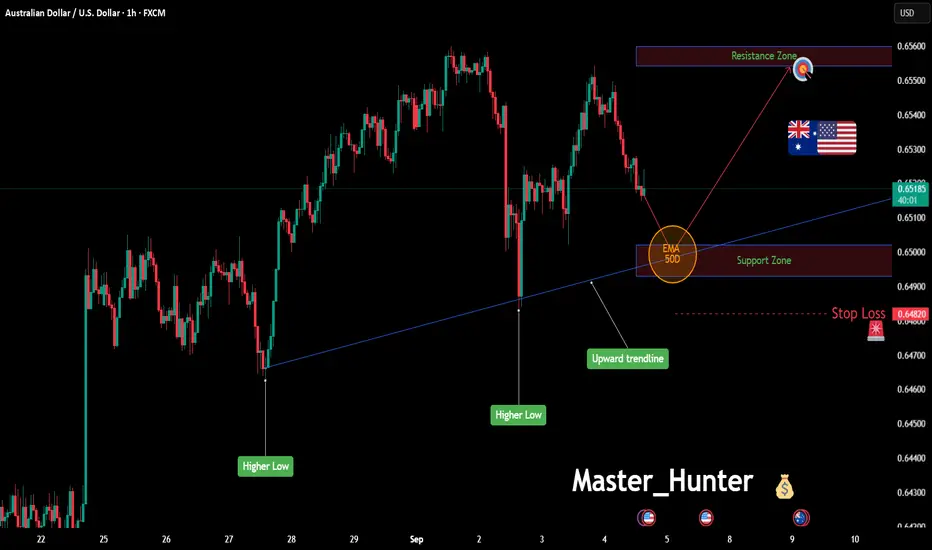
Moving into Week 37, my highest-probability bias is firmly long. The Week 36 candle closed bullish above the Weekly 50 EMA, signaling strong buying pressure around that level. Trading in line with the higher timeframe, liquidity clearly favors the buy side.
-Continued long breaks of structure confirm directional strength.
- Best long entries will come from the lows of the range, while best short term shorts will be from the highs.
This doesn’t rule out short opportunities, but they should be managed aggressively as they run counter to the overall bias.
Here’s how I plan to execute long positions: on the chart you’ll notice a mix of colors—this is my method of identifying and aligning order blocks and voids across multiple timeframes to build confluence for entries.
High-Probability Zones
Zone 1
Daily 50 EMA
Previous daily wick low
4H & 1H order blocks
4H 50 EMA
Final higher low before last market close
👉 Heavy confluence in this zone. I’ll look for longs from here during London Open, ideally price opens in the LDN session at the low of the Asia range. Adding further confluence to the positon.
Execution: Wait for a 1-min break of structure post London open inside the zone from a refined 15-min order block created in Asia or the 15' order block below the range.
Zone 2
Weekly 50 EMA
Previous week’s wick imbalance
4H & 1H order blocks
👉 Strong confluence but caution is needed: at this point, the daily candle may close below the Daily 50 EMA, reducing long confidence.
Execution: Safer play is to wait for the daily to reclaim above the Daily 50 EMA, then enter on an imbalance fill. Patience required—don’t rush.
Zone 3
Daily, 4H & 1H order blocks
Previous week’s wick imbalance
👉 At these ultimate lows, all EMA confluence is lost. Still, if price reaches this zone later in the week, I’ll be confident in a long. Why? Because the weekly candle is forecasted to close above the Weekly 50 EMA.
Execution: Wait for a clear break of structure in the zone before entering longs.
Key Notes
Zone 1 longs will be managed aggressively (scalps), as price may dip deeper towards Zones 2 or 3 before rejecting higher.
Expect possible fakeouts early in the week, with price dipping below the Weekly 50 EMA before rejecting upward.
Best setups will come from refined 15-min order blocks inside the higher-probability zones.
✅ Summary:
My Week 37 bias remains firmly bullish on AUDUSD. I’ll be focusing on long setups from Zones 1–3, refining with lower-timeframe order blocks and structure breaks. Shorts remain countertrend and will be managed tightly.
FRGNT
FX:AUDUSD

AUD/USD Ascending Triangle Breakout – Bulls Eyeing 0.6600AUD/USD is forming an Ascending Triangle on the 4H chart, showing bullish pressure building after multiple Change of Character (CHoCH) and Break of Structure (BOS) confirmations.
Support Level: 0.6400
Support Zone: 0.6450 – 0.6470
Resistance Area: 0.6600
Currently, price has broken above the descending trendline, suggesting bullish continuation if momentum holds. A retest of the breakout zone could provide a potential long opportunity, with targets toward the 0.6600 resistance area.
Breakout from Ascending Triangle
Higher highs with strong demand at support
Bullish continuation expected if price holds above 0.6500
This is not financial advice. Always manage risk and use proper risk-reward ratios before entering trades.

AUDUSD LONG NEXT WEEK! |OSOK|Hello friends, this is Joe_Blaq here and I thank you for reading this bit about fundamental analysis + technical analysis.
FUNDAMENTAL ANALYSIS
AUD currently experiences an economic boost since the GDP came out positive last month, USD on the other hand experiencing a decline in their GDP as inflation surges high and interest rate too high, leaving manufactures not option than to raise prices of their goods. This has also caused companies to lay-off their workers as their they can't borrow money because of high intrest rate.
So if we are applying the principle of buying the rumour and selling the fact then we should be buying AUD and sell USD since it is anticipated that the FED is going to cut rate to stabilize the economy next 2 weeks.
TECHNICAL ANALYSIS
AUDUSD bounced of a monthly support level at 0.61350 signaling a move to take out the high at 0.69500.
On the weekly price has developed a bullish market structure . With this weekly outlook I am anticipating next week to continue the longs with a little contraction/accumulation on monday and tuesday and expansion during wednesday to friday as the inflation news are released.
Thanks for you attention.


AUD/USD: Bullish Push to 0.65543?As the previous analysis worked exactly as predicted, FX:AUDUSD is setting up for a bullish move on the 1-hour chart , with an entry zone between 0.64930-0.65020 near a key support level.
The target at 0.65543 aligns with the next resistance, offering a solid upside play. Set a stop loss on a close below 0.6482 to manage risk effectively. 🌟
Watch economic data! 💡
📝 Trade Plan:
✅ Entry Zone: 0.64930 – 0.65020 (support area)
❌ Stop Loss: Daily close below 0.6482 to manage risk
🎯 Target: 0.65543 (next resistance)
Ready for this move? Drop your take below! 👇
AUDUSD rebound resistance at 0.6560Trend Overview:
The AUDUSD currency price remains in a bullish trend, characterised by higher highs and higher lows. The recent intraday price action is forming a continuation consolidation pattern, suggesting a potential pause before a renewed move higher.
Key Technical Levels:
Support: 0.6420 (primary pivot), followed by 0.6400 and 0.6370
Resistance: 0.6560 (initial), then 0.6590 and 0.6620
Technical Outlook:
A pullback to the 0.6420 level, which aligns with the previous consolidation zone, could act as a platform for renewed buying interest. A confirmed bounce from this support may trigger a continuation toward the next resistance levels at 0.6560, 0.6590, and ultimately 0.6620.
Conversely, a daily close below 0.6420 would suggest weakening bullish momentum. This scenario would shift the bias to bearish in the short term, potentially targeting 0.6400 and 0.6370 as downside levels.
Conclusion:
AUDUSD maintains a bullish structure while trading above the 0.6420 support. A bounce from this level would validate the consolidation as a continuation pattern. The loss of this level and a daily close below would suggest deeper corrective risk.
This communication is for informational purposes only and should not be viewed as any form of recommendation as to a particular course of action or as investment advice. It is not intended as an offer or solicitation for the purchase or sale of any financial instrument or as an official confirmation of any transaction. Opinions, estimates and assumptions expressed herein are made as of the date of this communication and are subject to change without notice. This communication has been prepared based upon information, including market prices, data and other information, believed to be reliable; however, Trade Nation does not warrant its completeness or accuracy. All market prices and market data contained in or attached to this communication are indicative and subject to change without notice.

AUDUSD long- Good AUD GDP growth q/q. RBA November cut bets reduced
- Fed rate cut still pricing in for USD

AUDUSD – Market Sentiment & Short-Term PlanThe Australian Dollar has lifted higher, supported by stronger-than-expected GDP data and improving global sentiment, while the US Dollar loses momentum. Optimism around China’s recovery adds further fuel, reinforcing AUD’s resilience despite broader market uncertainty.
🔹 Key Drivers:
Australian GDP surprise: Q2 growth at 0.6%, double the previous quarter and above forecasts, signals robust domestic demand and business confidence.
China’s rebound: Stronger services data points to recovery in Australia’s top export market, boosting trade outlook.
US Dollar softness: Concerns about slowing US growth and weaker labor market indicators weigh on the Greenback.
Global sentiment: Easing fears around debt and fiscal risks reduce safe-haven demand, favoring risk currencies like the Aussie.
📉 AUDUSD H1 Technical Outlook (Descending Channel):
Price action is contained within a lower highs / lower lows structure.
Resistance trendline: 0.6550 – 0.6560
Support trendline: 0.6420 – 0.6440
🎯 Short-Term Trading Plan:
🔽 Sell Setup: Watch for rejection near 0.6550 – 0.6560, SL above 0.6580, TP1: 0.6480, TP2: 0.6440.
🔼 Buy Setup: Aggressive longs near channel support 0.6420 – 0.6440, SL below 0.6400, TP1: 0.6500, TP2: 0.6550.
Breakout scenario: A sustained close above 0.6560 could signal bullish reversal, while a drop under 0.6420 would confirm extended downside.
⚠️ Key Watch: US labor data and China’s growth indicators remain critical drivers. Volatility likely around high-impact releases.

AUDUSD Daily Forecast -Q3 | W36 | D4 | Y25📅 Q3 | W36 | D4 | Y25
📊 AUDUSD Daily Forecast
🔍 Analysis Approach:
I’m applying Smart Money Concepts, focusing on:
Identifying Points of Interest on the Higher Time Frames (HTFs) 🕰️
Using those POIs to define a clear trading range 📐
Refining those zones on Lower Time Frames (LTFs) 🔎
Waiting for a Break of Structure (BoS) for confirmation ✅
This method allows me to stay precise, disciplined, and aligned with the market narrative, rather than chasing price.
💡 My Motto:
"Capital management, discipline, and consistency in your trading edge."
A positive risk-to-reward ratio, paired with a high win rate, is the backbone of any solid trading plan 📈🔐
⚠️ Losses?
They’re part of the mathematical game of trading 🎲
They don’t define you — they’re necessary, they happen, and we move forward 📊➡️
🙏 I appreciate you taking the time to review my Daily Forecast.
Stay sharp, stay consistent, and protect your capital
— FRNGT 🚀
FX:AUDUSD

Technical Study: Bearish Marubozu within Lower Low TrendIn the current market context, we can observe:
A Lower Low structure, which reflects continuous bearish momentum.
A Bearish Marubozu candle on H1, indicating strong selling pressure with minimal rejection.
Both of these technical elements suggest that the market environment is currently leaning toward bearish conditions.
===============================================
Example of Trading Plan (for Educational Purposes)
Entry & Stop Loss
Example entry considered at the 50% retracement level of the H1 Bearish Marubozu.
Example Stop Loss (SL) placed just above the Marubozu high.
Approximate SL distance: 9 pips.
Take Profit (TP)
A sample Risk : Reward ratio of 1 : 2.5 is applied.
The TP is aligned with a visible base/support zone below, which could act as a reaction area.
With a 9-pip SL, the TP projection would be around 22–23 pips.
===============================================
Key Takeaway
This setup is an example of how to combine candlestick structure with market trend analysis and apply risk management through risk–reward planning. The focus is on discipline in execution, not prediction.
===============================================
Disclaimer:
This analysis is for educational purposes only and does not constitute a recommendation to buy or sell. It is intended to demonstrate how money management and setup structures can be applied. Risk of loss exists, as well as potential for profit.
HOW BULLS ARE STEPPING-IN ON AUDUSD Price has tapped into a demand zone around 0.65250 after a strong sell-off during Frankfurt and NY sessions. We’re now seeing signs of reaction from this level, with a possible upside continuation towards 0.65350 and 0.65527.
🔹 Key levels to watch:
Demand zone: 0.65145 – 0.65250
Short-term target: 0.65350
Main target: 0.65527
💡 Idea: Waiting for confirmation around the demand zone before going long. If buyers hold this level, we could see a clean move to the upside.
⚠️ Risk: If 0.65145 breaks, bearish momentum may extend further.
👉 What’s your bias here? Are you looking to buy the dip or ride the continuation down? Drop your thoughts in the comments!
🔥 Follow me for more chart updates, setups, and live market insights.

AUD/USD – SNR SetupPrice holding strong support at 0.6512–0.6520.
Upside potential toward 0.6578 resistance with solid RRR.
⚖️ Bias: Bullish above support | Watch for rejection near resistance.
#AUDUSD #Forex #Trading #SNR #PriceAction

Bearish drop off?The Aussie (AUD/USD) has rejected off the pivot and could drop to the 61.8% Fibonacci support.
Pivot: 0.6556
1st Support: 0.6469
1st Resistance: 0.6589
Risk Warning:
Trading Forex and CFDs carries a high level of risk to your capital and you should only trade with money you can afford to lose. Trading Forex and CFDs may not be suitable for all investors, so please ensure that you fully understand the risks involved and seek independent advice if necessary.
Disclaimer:
The above opinions given constitute general market commentary, and do not constitute the opinion or advice of IC Markets or any form of personal or investment advice.
Any opinions, news, research, analyses, prices, other information, or links to third-party sites contained on this website are provided on an "as-is" basis, are intended only to be informative, is not an advice nor a recommendation, nor research, or a record of our trading prices, or an offer of, or solicitation for a transaction in any financial instrument and thus should not be treated as such. The information provided does not involve any specific investment objectives, financial situation and needs of any specific person who may receive it. Please be aware, that past performance is not a reliable indicator of future performance and/or results. Past Performance or Forward-looking scenarios based upon the reasonable beliefs of the third-party provider are not a guarantee of future performance. Actual results may differ materially from those anticipated in forward-looking or past performance statements. IC Markets makes no representation or warranty and assumes no liability as to the accuracy or completeness of the information provided, nor any loss arising from any investment based on a recommendation, forecast or any information supplied by any third-party.

AUDI gonna execute tow trade in here ,AT the first I gonna buy it and after get profit I gonna put all profit in selling like compounding

Long trade
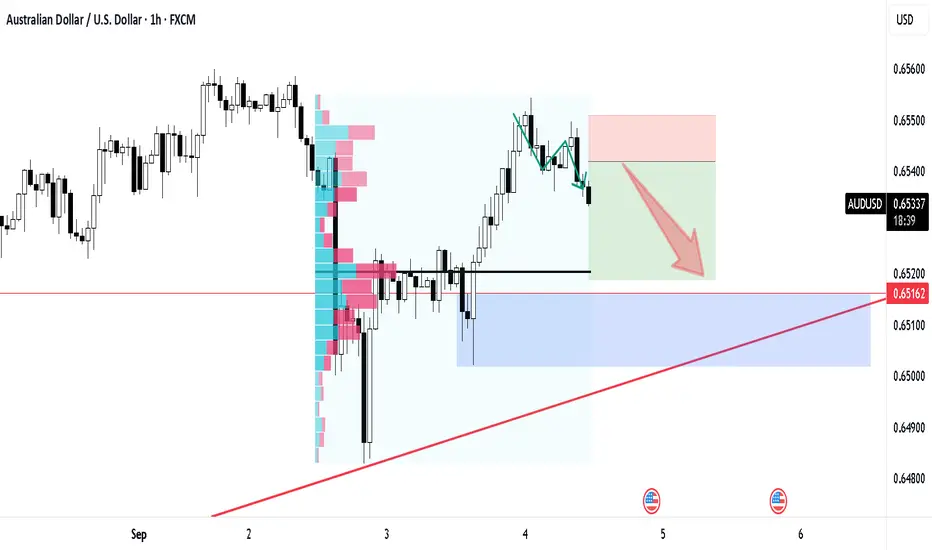
Trade Journal Entry – AUD/USD
Pair: AUD/USD
Timeframe: 30 minute
Session Context: London → New York AM
🟢 Trade Setup
Type: Buyside
Date: Wed 3rd Sept 25
Session: 5:30 am, London to NY AM
Entry: 0.65293
Stop Loss: 0.65251 (0.06%)
Take Profit: 0.65586 (0.45%)
Risk per Trade: 1.0%
R: R Ratio: 6.98
🔑 Observations
Strong rejection of the prior demand zone before the London open.
Clean Fair Value Gap (FVG) fill followed by an impulsive bullish drive.
Entry positioned at retracement inside London → NY handoff volatility window.
Tight stop management enhances RR by nearly 7:1. The trade aligns with intraday session bias, favouring a liquidity sweep below the Asian low before moving higher.

AUD/USD 15m Analysis1. Market Structure
Price previously moved within a bullish channel, but momentum is weakening. A strong rejection appeared from the 0.8550 – 0.8570 demand zone, turning it into a valid sell area.
2. Key Levels
Sell Zone (Demand turned Supply): 0.8550 – 0.8570
Target Zone (Supply below): 0.8495 – 0.8515
Key SNR / Fibonacci 0.786: around 0.8517
3. Trade Setup
Sell Entry: From the rejection at 0.8550 – 0.8560
Stop Loss: Above 0.8570
Take Profit: 0.8515 – 0.8500
Risk-to-Reward: ~1:3
4. Confirmation
If price closes below 0.8530 on H1, bearish continuation is likely.
A breakout above 0.8570 will invalidate the bearish scenario.
5. Conclusion
📉 Current Bias: Bearish
Looking for continuation to the downside.
Best setup: Sell below 0.8560, targeting 0.8515 – 0.8500.

AUDUSD InsightWelcome, subscribers!
Please share your personal opinions in the comments. Don’t forget to like and subscribe.
Key Points
- The final reading of the Eurozone Services PMI for August came in at 50.5, slightly below the flash estimate of 50.7, but still above the 50 threshold that separates expansion from contraction.
- U.S. job openings in July stood at 7.181 million, the lowest level in ten months since September last year, down 176,000 from the previous month and below market expectations of 7.4 million.
- Australia’s Q2 GDP growth was 0.6%, beating market expectations of 0.5%. The growth was driven by a recovery in consumption supported by interest rate cuts and government tax relief measures. Compared with the same period last year, GDP grew 1.8%, the highest since 2023, though still well below the normal level of 2.5%.
Major Economic Events This Week
+ September 4: U.S. August ADP Nonfarm Employment Change
+ September 5: U.S. August Nonfarm Payrolls, U.S. August Unemployment Rate
AUDUSD Chart Analysis
The price is showing small movements around the 0.65000 level near the trend line. While there is still room for upward potential, the lack of supporting catalysts seems to be limiting the rise. If positive drivers emerge, the pair is expected to break through the 0.66000 level and continue its upward trend toward 0.69000. However, if downward pressure strengthens due to external factors, it will be important to watch whether the pair breaks below the 0.64000 level. A break below this level could open the way down to 0.62000.

AUD-USD Resistance Ahead! Sell!
Hello,Traders!
AUD-USD keeps growing
But a strong horizontal
Resistance of 0.6568
Is ahead so after the
Retest we will be
Expecting a local pullback
Sell!
Comment and subscribe to help us grow!
Check out other forecasts below too!
Disclosure: I am part of Trade Nation's Influencer program and receive a monthly fee for using their TradingView charts in my analysis.

AUDUSD Daily Forecast -Q3 | W36 | D3 | Y25 NY FORECAST 📅 Q3 | W36 | D3 | Y25
📊 AUDUSD Daily Forecast
🔍 Analysis Approach:
I’m applying Smart Money Concepts, focusing on:
Identifying Points of Interest on the Higher Time Frames (HTFs) 🕰️
Using those POIs to define a clear trading range 📐
Refining those zones on Lower Time Frames (LTFs) 🔎
Waiting for a Break of Structure (BoS) for confirmation ✅
This method allows me to stay precise, disciplined, and aligned with the market narrative, rather than chasing price.
💡 My Motto:
"Capital management, discipline, and consistency in your trading edge."
A positive risk-to-reward ratio, paired with a high win rate, is the backbone of any solid trading plan 📈🔐
⚠️ Losses?
They’re part of the mathematical game of trading 🎲
They don’t define you — they’re necessary, they happen, and we move forward 📊➡️
🙏 I appreciate you taking the time to review my Daily Forecast.
Stay sharp, stay consistent, and protect your capital
— FRNGT 🚀
FX:AUDUSD

AUDUSD | Supply Zone Rejection – Short OpportunityPrice has tapped into a high-timeframe supply POI that aligns with imbalance (IMB) and a break of structure (BOS). The reaction from this zone suggests sellers may take control, targeting inefficiencies left below.
Key points:
Supply Zone: Confluence of POI + IMB + BOS around 0.6540.
Liquidity Sweep: Recent push captured liquidity before rejection.
Fair Value Gaps (FVGs): Multiple downside inefficiencies waiting to be filled.
Projection: Expecting bearish continuation towards 0.6490 and potentially deeper if momentum sustains.
📉 Watching for confirmation of rejection and clean bearish structure to develop before continuation.
invalid if price closes above 0.65444

AUD/USD BEST PLACE TO SELL FROM|SHORT
AUD/USD SIGNAL
Trade Direction: short
Entry Level: 0.652
Target Level: 0.649
Stop Loss: 0.655
RISK PROFILE
Risk level: medium
Suggested risk: 1%
Timeframe: 1h
Disclosure: I am part of Trade Nation's Influencer program and receive a monthly fee for using their TradingView charts in my analysis.
✅LIKE AND COMMENT MY IDEAS✅
